

Is Trading the FED's POMO Schedule Profitable?
/I often consider the market's distortions that are or can be created by its participants. Arguably, the most important market player is the Federal Reserve. For years the FED as been injecting liquidity into the financial system through its Permanent Open Market Operations (POMO). I'm not going to delve into the purpose of these multibillion dollar transactions as others have covered this extensively. Instead I ask a simple question. The FED makes their tentative POMO schedule public beforehand. Can a trader simply buy the market open and sell the close each day the FED engages in POMO and earn a profit? The simple answer is 'yes'! To set up this study; I compared the FED"s historical POMO calender from January 2010 until August 3rd 2013 , to S&P 500 (SPX) returns for the matching dates. The return is based on a trader purchasing the SPX on open and closing the position at the end of day. I've provided the histogram of returns below along with an overlay of the density plot.
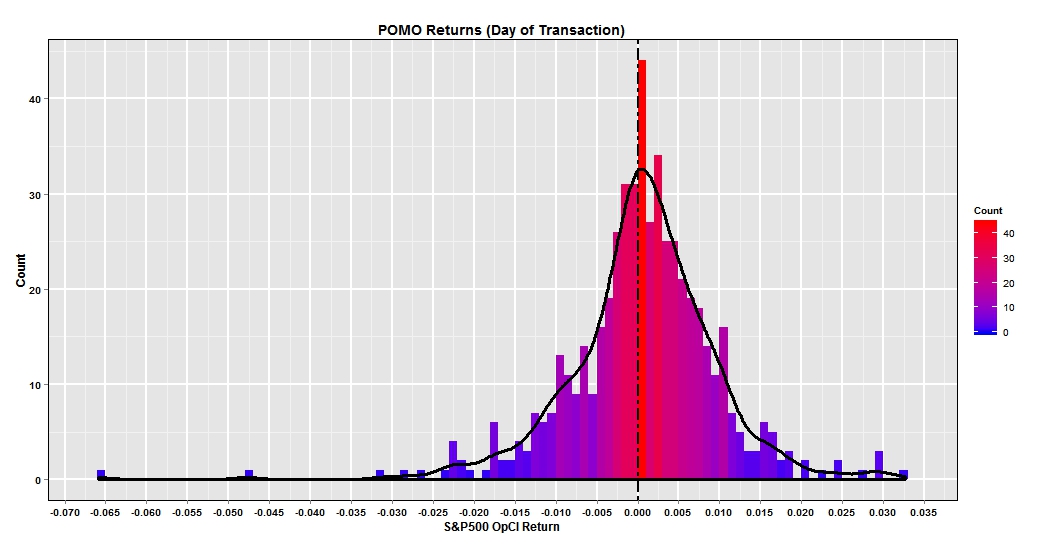
We can see that the returns have a slight negative skew with a couple >-4% days. Additionally the mode is just to the right of zero between 0 and 1%.. For context, the simple annualized sharp ratio is 0.51. Not great but slightly positive. I wondered if there could be a simple improvement to the strategy. What if the SPX trade was instead executed on the POMO settlement day which occurs the next trading day? The histogram below plots the return results.
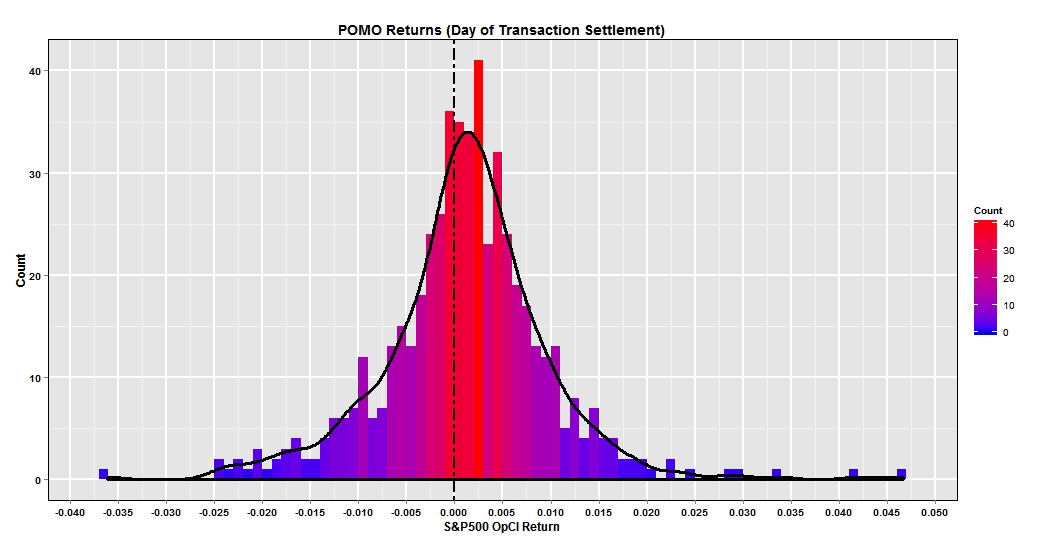
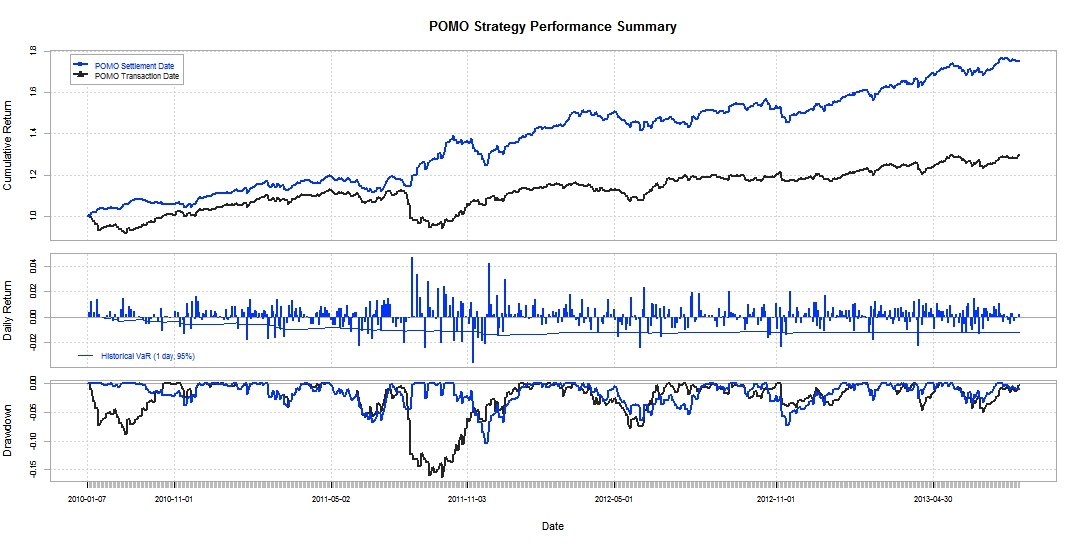
To my surprise this strategy was a large improvement. First there were no days with negative returns in excess of -4%. The mode is clearly positive approximating 2.5% and there appears to be a slight positive skew. For comparison the annualized Sharpe ratio is 1.76-Definitely respectable. Looking at the performance summary helps to compare the strategies. The first panel is a wealth index based on the cumulative value of $1 over the period. Clearly the settlement date strategy blows away the transaction date strategy by 40+% with a drawdown not exceeding 10% over the testing period.
Let me emphasize that the strategy may or may not be tradable today. On a superficial basis the strategy appears to be promising, But further research and more indepth analysis would have to be done, analyzing actual transactions, portfolio size, scale, and so on.
To construct the charts and run my analysis I used R!'s GGPLOT2 and PerformanceAnalytics packages along with Moments, Scales, and Quantmod.
