

Institutional Level Long/Short Strategies in Quantopian (OCF/EV)
/Post Outline
- Background
- Strategy Summary
- Implementation Details
- Strategy Results and Analysis
- References (Notes)
Background
Recently I was blessed with an introduction to S&P Global-Market Intelligence's Director of Business Development, Matt Morrissy and gifted a trial membership to the S&P Capital IQ platform [1]. Specifically, I was given an opportunity to review and provide feedback for their "Alpha Factor Library." Their team, the Quantamental Group [2], has researched and developed several hundred various factors across the investment themes spectrum including but not limited to: price momentum, earnings quality, valuation, volatility, etc.
The Capital IQ offerings and Quantamental group's research is fantastic. However, due to the size, diversity and sophistication of their client base [3], most factors are not tested in a production ready fashion. This means the factors are not backtested to include any assumptions of market frictions such as commissions, and liquidity constraints.
Pouncing on the opening, I asked, and was granted the opportunity to test some of the factors in the Quantopian platform. As always, at Blackarbs, the focus is on realistic implementation and profitability. Unfortunately, too many research papers publish amazing results that cannot be replicated, or fail with even the slightest change in market friction assumptions. Let's put the first strategy to the test.
Strategy Summary
The factor we are testing is in the valuation theme [4]. We look at the ratio of operating cash flow (OCF) to the enterprise value (EV). OCF is a measure of cash generated by a firm's "normal" business operations. EV is the theoretical takeover price or buy price for a firm. OCF/EV can be thought of as a measure of how much cash the firm generates relative to its takeover price. A high ratio indicates great value as the firm generates lots of cash compared to its EV. A low ratio indicates low value as the firm is worth way more than the cash flow it generates.
This strategy first filters the Quantopian universe to approximately 2500-3000 stocks. Then it sorts the stocks according to the OCF/EV ratio and bins the stocks into quintiles. The top quintile is bought and the bottom quintile is sold.
Implementation Details
- Market Neutral: It attempts to maintain equal dollar value invested in both long and short legs.
- Sector Neutral: The strategy attempts to maintain sector weights equal to that of a specified index/benchmark.[5]
- Monthly Holding Period: The strategy holds positions for one month before factor rebalancing.
- Weekly Target Portfolio Rebalancing: The strategy compares the current portfolio weights to the target portfolio weights. If any position is outside the target weight +/- 5% then the algorithm sends orders to rebalance the portfolio to the target. This is to prevent the portfolio from drifting too far outside the target weights.
- No other factors are considered: No momentum overlays, no stop losses or profit targets, no crash protection, etc.
- Simulated Portfolio size is $10,000,000.
- Commissions and Slippage constraints are shown below:
Strategy Results and Analysis
Basic Strategy Summary:
RESULTS SIMULATED USING QUANTOPIAN PLATFORM
Detailed Strategy Analysis:
RESULTS SIMULATED USING QUANTOPIAN PLATFORM
Annual return is a solid 8% over an ~12 year period. Annual volatility is in the single digits at ~7% per year! Sharpe ratio is greater than 1, and max drawdown is also single digits at 9%! There is slight negative skewness which is ok. Alpha is a healthy 8%. Beta is effectively zero! All are solid traits of an effective market neutral strategy.


Cumulative returns are great. Volatility matched returns are impressive.
RESULTS SIMULATED USING QUANTOPIAN PLATFORM
In 10 of 12 years the strategy finished in plus territory which is excellent. The strategy was able to tread water in 2009 and 2010, suffering very small losses.

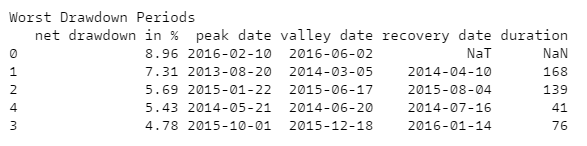
Drawdowns are manageable and realistic (<10%). The drawdown duration is also reasonable in that the longest duration was approximately 8 months. It is somewhat concerning that the largest drawdowns all occurred within the last 3 years. This would definitely be something to track closely.
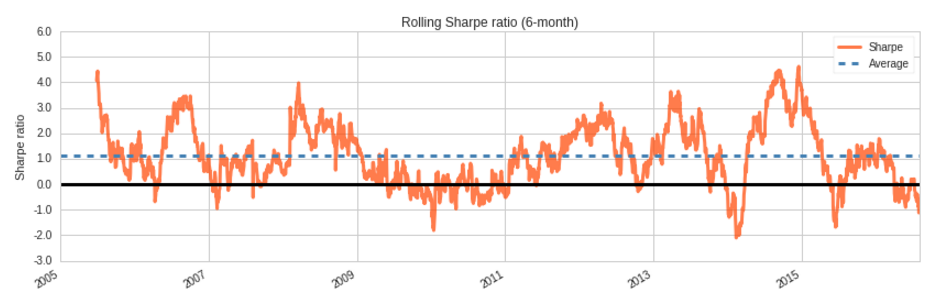
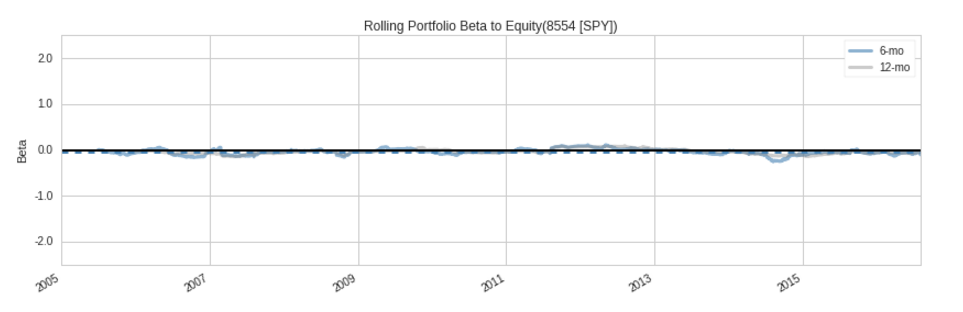
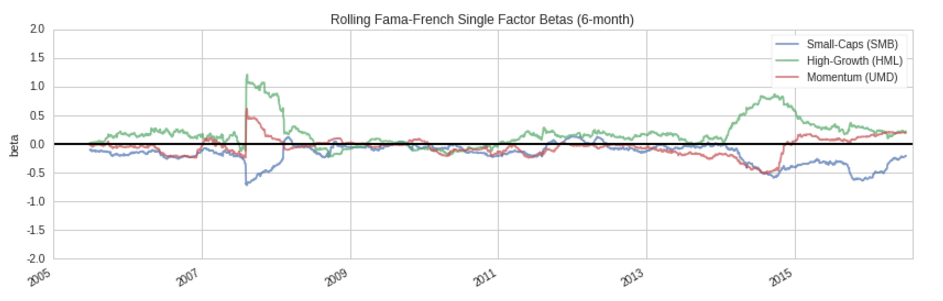
Rolling Sharpe is ok; the average is greater than 1 which is a positive. Rolling beta is effectively zero which is indicative of a true market neutral strategy. Overall the strategy is indifferent to the Fama-French factors except for ~2008 and ~2014-15.


Gross leverage never exceeds the Quantopian max of 3x. However, what is not shown is that net leverage was consistently near zero indicating long and short positions were balanced. The Long/Short Exposure plot shows this quite well. Turnover seems reasonable given that the strategy maintained anywhere from ~400-500 positions at a time. Trading volume seems to be increasing over time but that could be illusory due to the recent large spike in late 2015/early 2016. Position exposure is what we would expect with the top long position weighted less than 2% and the top short position less than 3%.


The strategy is mostly indifferent to the stress events identified above. During 13 of 17 events the strategy recorded non-negative average returns. Overall, the strategy appears to be unaffected by various types of market stress events.
References (Notes):
- S&P Global Market Intelligence - Alpha Factor Library. For Inquiries contact Matt Morrissy via mmorrissy@spglobal.com
- S&P Capital IQ - Quantamental Research
- Institutional clients have unique strategy/implementation costs that are likely impossible to generalize accurately.
- My strategy is not an EXACT replication of the S&P alpha factor strategy. I did not ensure that the relevant fundamental data points encompassed the same lookback period. Instead, I simply used the default point-in-time data provided by Morningstar via the Quantopian platform.
- The sector neutral benchmark in this example is a stylized version of the Russell 3000 index. The Russell 3000 index is rule based so creating a proxy index via the Quantopian platform was simpler. However, it is not exact as I added additional screens to exclude certain stock issues, foreign ADR's, stocks with missing data, etc. Sector neutrality in this case means portfolio sector weights matched to the weights of the filtered stylized index.
