

Blackarbs Retirement Strategy Algorithm Debut (Part 2)
/Join the growing Blackarbs Research Group Discord community [here]
Get access to the strategy that has returned 48% live trading since November 2023 [here] [updated: 2024-Mar-02]
Recap
In part 1 of the series, I introduced the blackarbs retirement algorithm, a long only leveraged ETF strategy meant to perform at or better than SPY (the market benchmark) with less volatility. I discussed the goals I set for the algo and how thus far in simulated backtests and live trading it has met those goals. In this post I want to talk about the development process and robustness testing of the algorithm.
Why it might be useful for your portfolio
I want to highlight who this algorithm is best suited for. It is designed for tax advantaged accounts, and long term investors who don’t mind a bit of active management. It is for those who don’t mind being on the sidelines at times while the market moves back and forth as that is the tradeoff between high returns and lowered volatility vs investing in an index product like SPY.
Some Strategy Highlights
SIMULATED OR HISTORICAL PERFORMANCE DISPLAYED IS FOR ILLUSTRATIVE PURPOSES ONLY AND DOES NOT GUARANTEE FUTURE RESULTS
CAGR is ~15% or 50% greater than the benchmark. Sharpe is above 1 which great. Max drawdown over the period is almost 15% less than the benchmark which is good considering 2020 is inside the sample. Longest drawdown period in the sample lasted just under a year versus SPY which is approaching 2 years since it’s high water mark. Links to all the performance data is shared at the end.
Robustness testing
The original strategy was created sometime in late 2016 based on research I published here on my website. It was great except except for a major flaw. It was exposed to massive crash risk since it was investing in leveraged ETFs.
A natural hedge for a strategy like this would be allocating some amount of funds towards a leveraged volatility instrument. However, those products (leveraged volatility ETNs) were somewhat unstable and only backed by the issuer who provided the ETN. As we saw in 2020, Credit Suisse delisted many of their ETN products including the popular TVIX. As this strategy is already more “risky” than a vanilla long only index portfolio I decided against using an asset like that in the algo construction.
The strategy has only 2 main parameters to optimize which is useful for robustness testing.
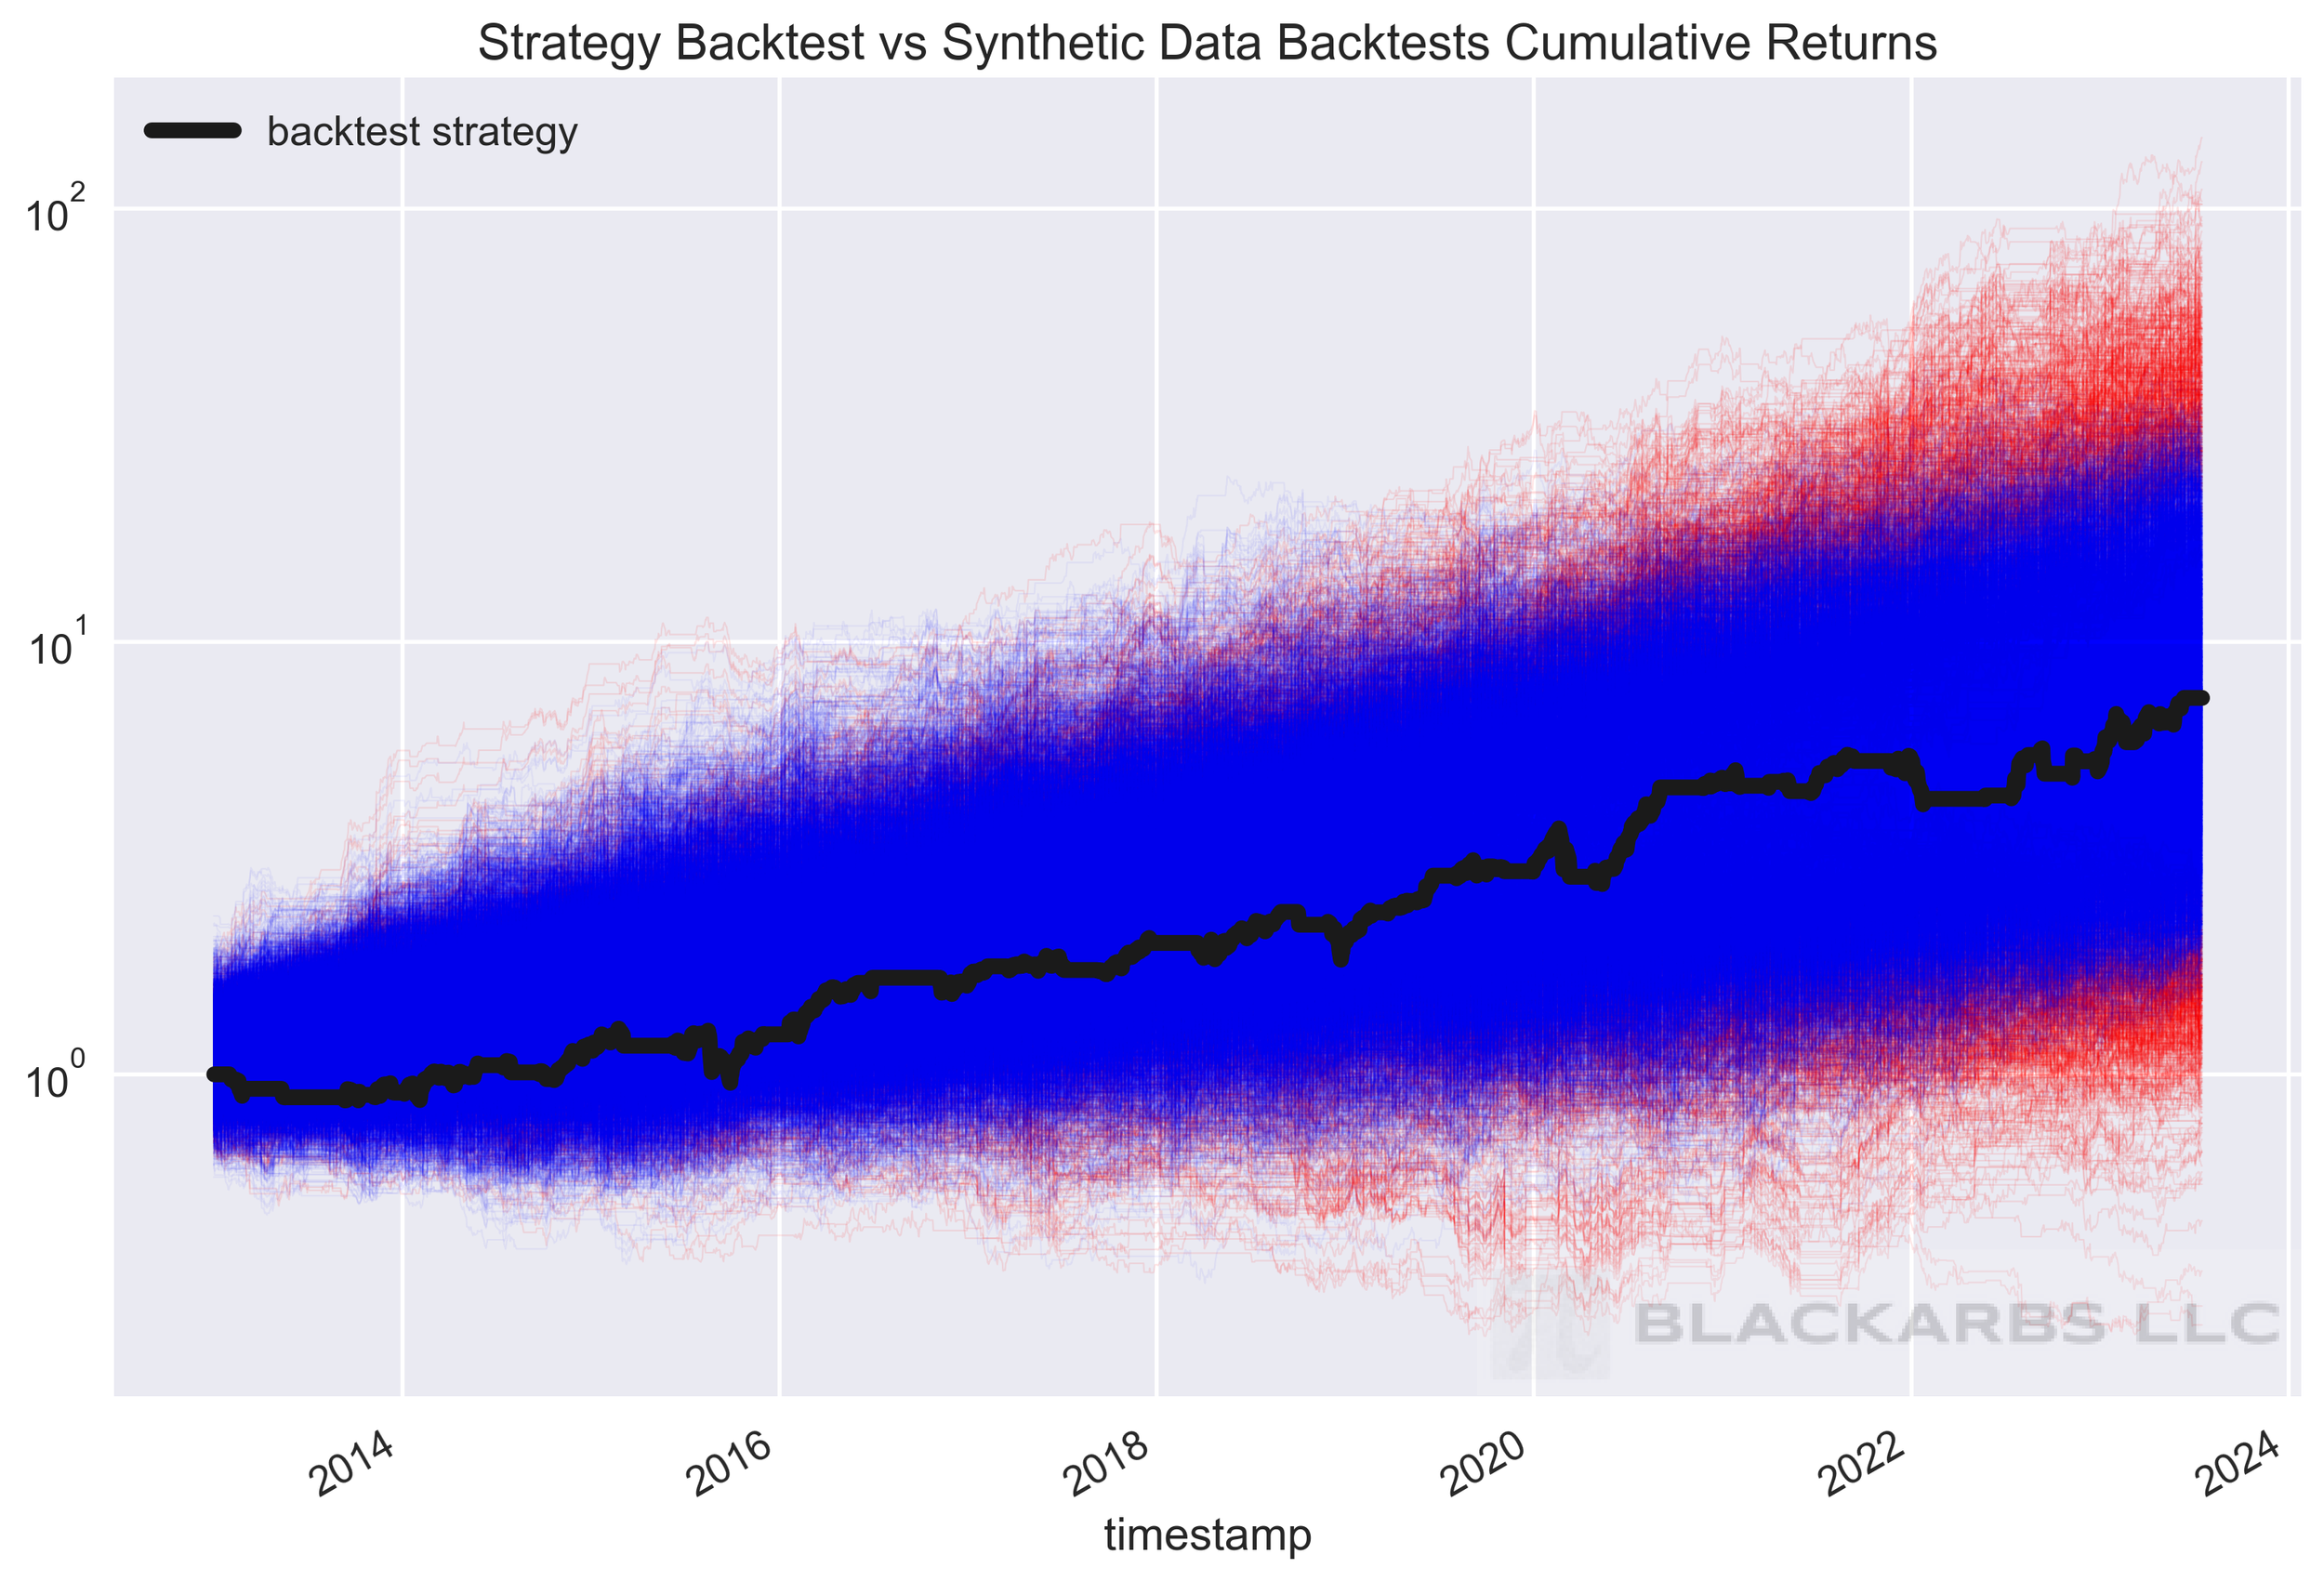
To test I ran optimizations on randomly generated paths for each asset
288 runs (limited by time and computation power)
90 optimization choices each
Top 10 of the best runs (sharpe ratio) had their parameters averaged together
Somewhat surprisingly these were almost equal to the parameters chosen by me initially and the single “real” path parameter optimization.
The “real” path optimization was done using the actual price histories for the assets in question.
Using the randomly generated portfolio backtests, I compared the sharpe and cagr percentiles to compare to the “real” backtest. Averaged around the 70th percentile. The idea is that the strategy should stand out against the randomly generated portfolio backtests, if it is exploiting an actual phenomena vs the randomly generated data.
SIMULATED OR HISTORICAL PERFORMANCE DISPLAYED IS FOR ILLUSTRATIVE PURPOSES ONLY AND DOES NOT GUARANTEE FUTURE RESULTS

SIMULATED OR HISTORICAL PERFORMANCE DISPLAYED IS FOR ILLUSTRATIVE PURPOSES ONLY AND DOES NOT GUARANTEE FUTURE RESULTS
I also tested rebalance times to see if optimization helped. Results didn’t change drastically however MarketOnOpen and MarketOnClose orders resulted in significant degradation of long run performance. Optimal performance came from entering the orders between 12 pm EST - 2 pm EST.
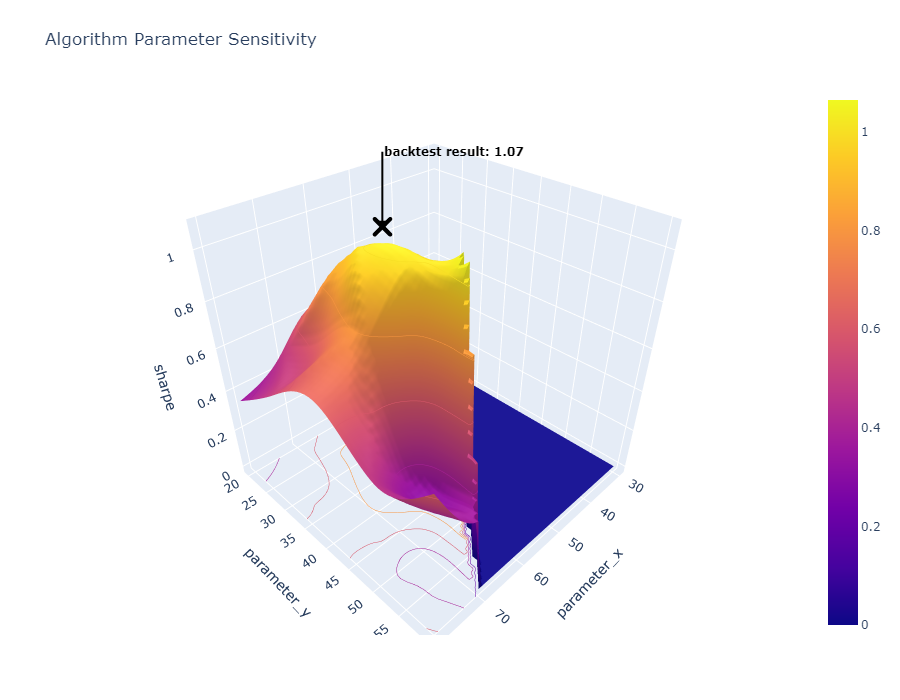
Key Results (Charts)
Below you will find the contour plots of the optimization and the results of the key metrics of CAGR, Sharpe, and Max drawdown. There are interactive plotly versions of those charts available also inside the shared folder linked below at the end.
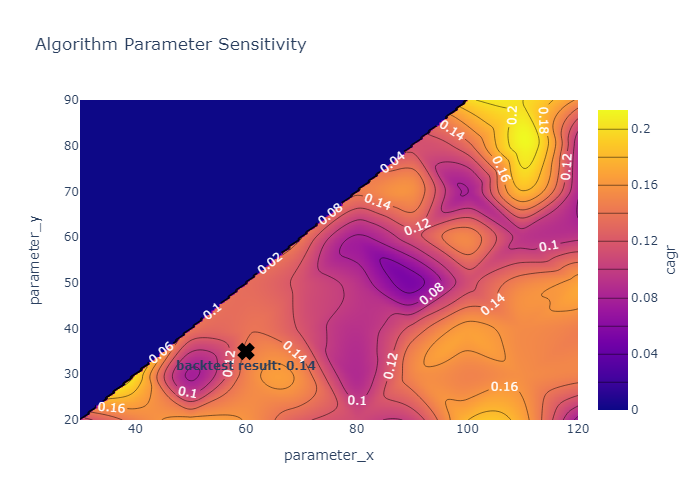
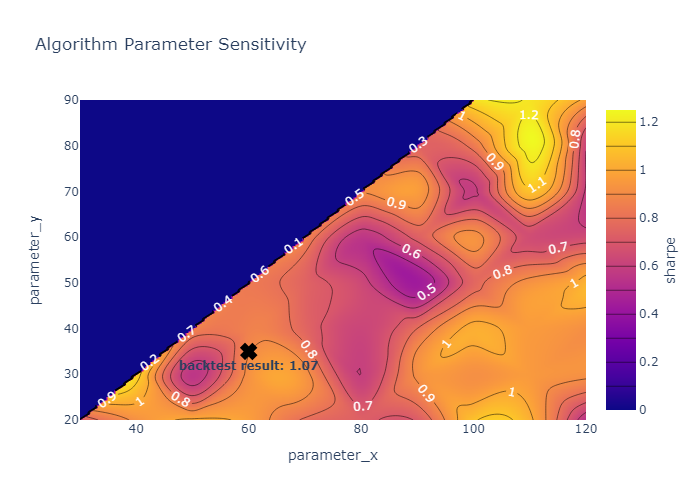
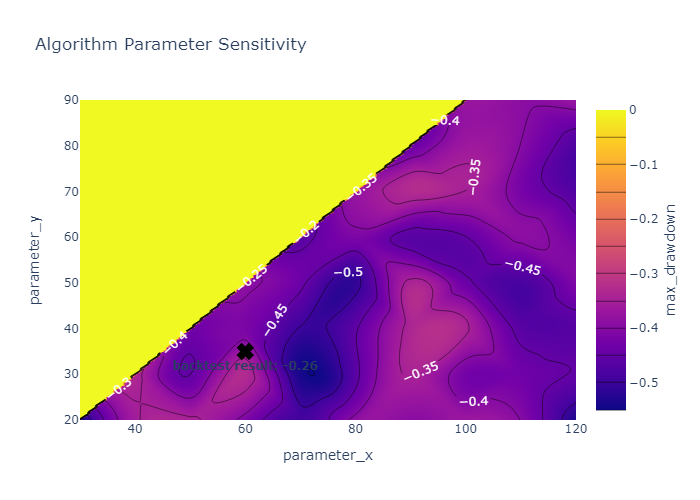
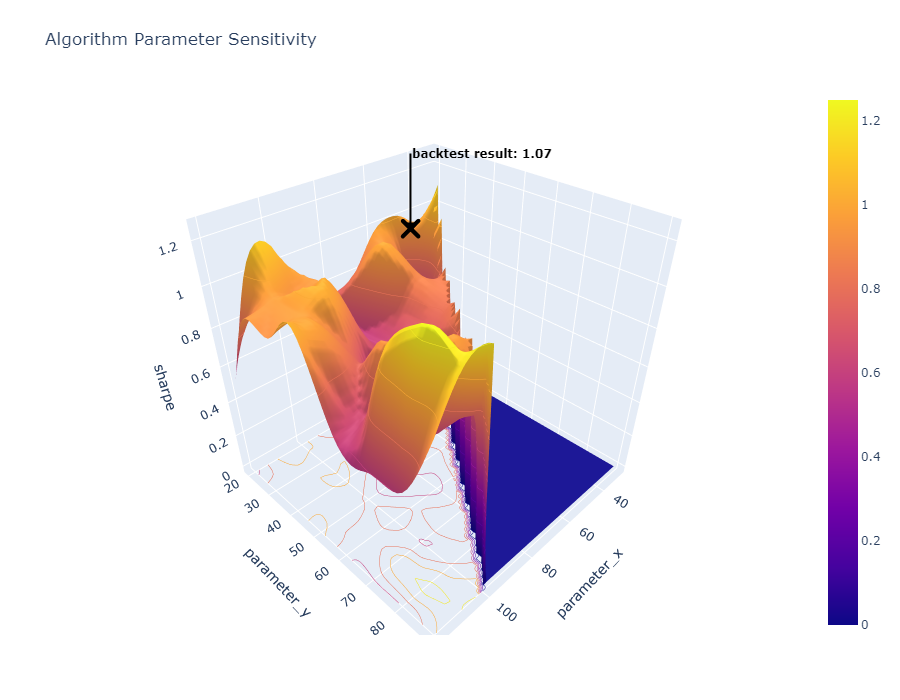
synthetic data optimization results
This section below highlights the results of the optimization run using synthetic data for each of the assets in the portfolio. Synthetic backtests were run using Pyqstrat and data at the m15 frequency for entries and exits. The fill model was relatively simple yet conservative. Buys were filled halfway between the open price and the high, and sells halfway between the close price and the low. These were run as of the end of October 2023. The x marked “backtest result” is the result of the backtest run using actual historical data
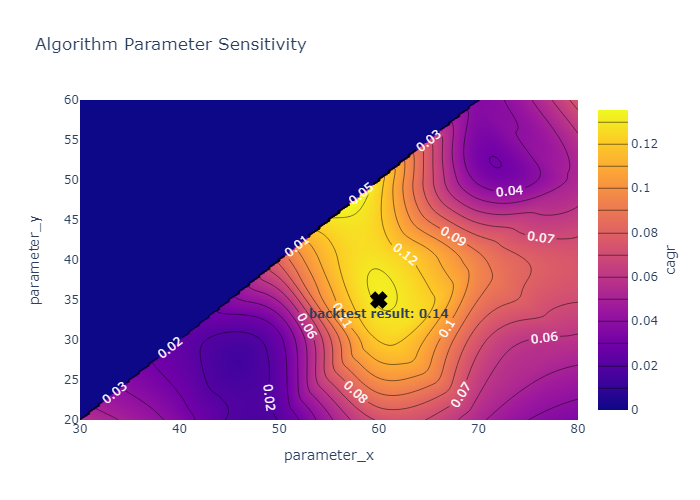
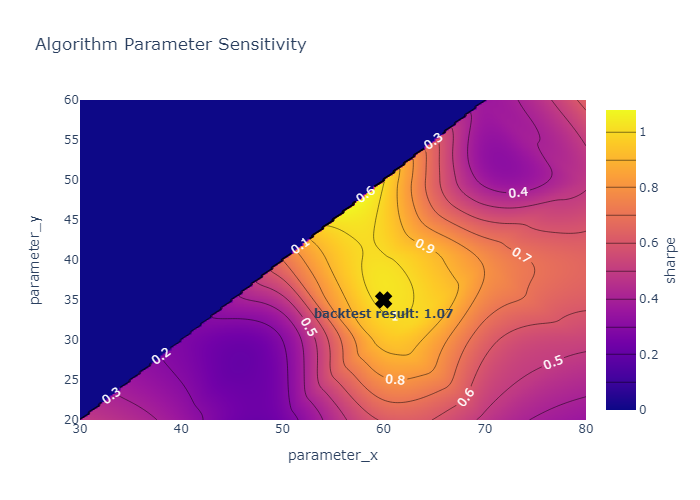
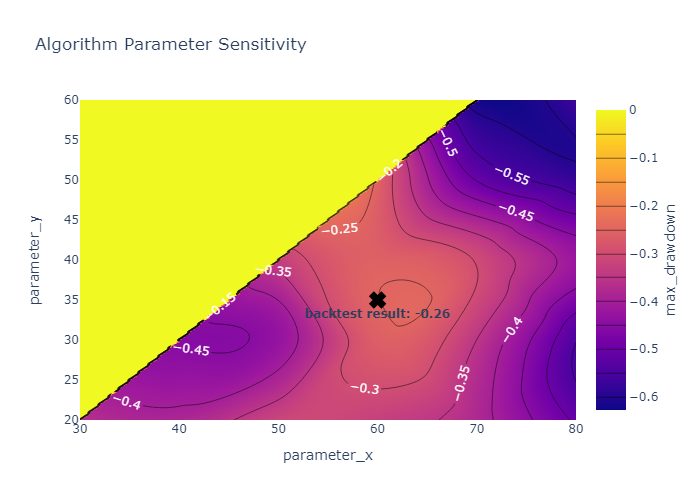
Real data optimization results
This section below highlights the results of the optimization run using the actual historical data for each of the assets in the portfolio. The backtests were run using Pyqstrat and data at the m15 frequency for entries and exits. The fill model was relatively simple yet conservative. Buys were filled halfway between the open price and the high, and sells halfway between the close price and the low. These were run as of the end of October 2023. The x marked “backtest result” is the result of the single optimized backtest run using actual historical data.
Link to Charts and Tearsheet Folder Below
Link to google drive folder [click here]
Current Research
Improving the market exit filter and attempting to reduce false positives using machine learning and other heuristics
There are many factors that can be tested as a volatility filter including yield curves and vix term structure which could potentially add to the accuracy of the current market filter.
Get access to the strategy that has returned 48% live trading since November 2023 [here] [updated: 2024-Mar-02]
