Bubble Bubble Toil and Trouble

castle-bravo-atomic-nuclear-bomb-test-e1372098014943.jpg

We had a perfect recipe for the “abrupt” correction that global asset markets have experienced. A quick look at the factors shows observant investors that caution was necessary leading up to the most recent FED meeting. 1)    Leverage as measured by NYSE margin debt released in May showed levels greater than that of 2007 and close to all time highs. This excessive risk appetite can be attributed to an extremely low interest rate environment and low volatility in the broader market. Said simply – leverage is cheap, and the stock market doesn’t decline for long, because of the FED put in the Bond markets… Chart courtesy of DShort @ Advisor Perspectives.

NYSE-investor-credit-SPX-since-1980


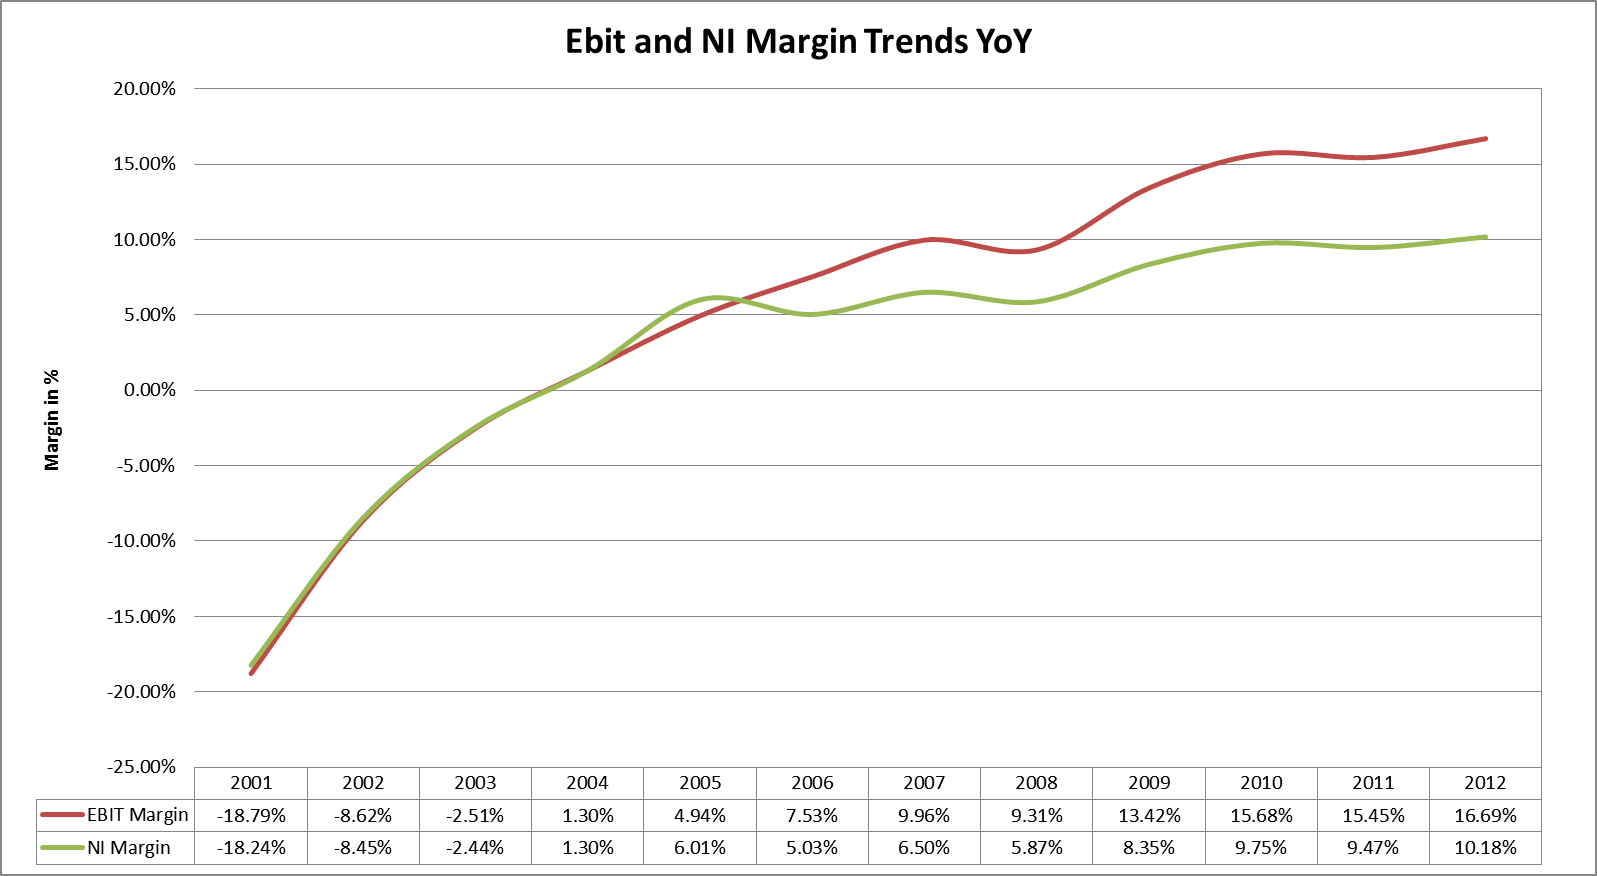
2)    Economic indicators have improved in an assymetric fashion in that corporate earnings and growth have been solid, jobless numbers have been improving along with retail sales and consumer confidence, but labor participation rate has a fairly steep negative trend, housing starts were trending positive but experienced a dramatic decline and real gdp has been volatile. Charts via the New York Times and FRED where applicable, sources are cited in chart.

[gallery columns="4" ids="211,207,206,205,204,203,202,201,200,199,198,197"]

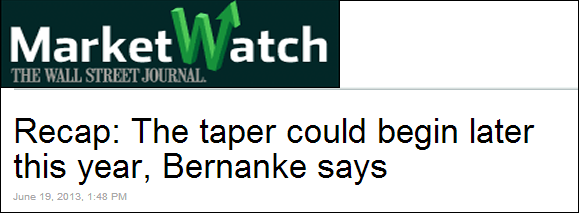
3)    About that FED put… It has been rumored for some time now that Bernanke and the FED had to begin its exit plan. Market participants have known sooner or later that day would come but volatility had been so low, and debts so large especially with the FED being the largest US debt purchaser that it always seem to be coming next year, or the year after. Well Bernanke slapped the market to attention when he said nothing to contraindicate the rumors that tapering could begin as soon as the 4th qtr of this year.

 Capture2

Whoops! So the mad rush begins as investors have no choice to begin deleveraging immediately. And by investors I don’t mean the average 401k or boutique investment shop. I’m talking about the big boys who literally move markets. These players are leveraged to the hilt and need to begin unwinding interlinked trades across various asset classes. Think carry trades used to speculate in emerging market assets, currencies, and leveraged bets using derivatives.

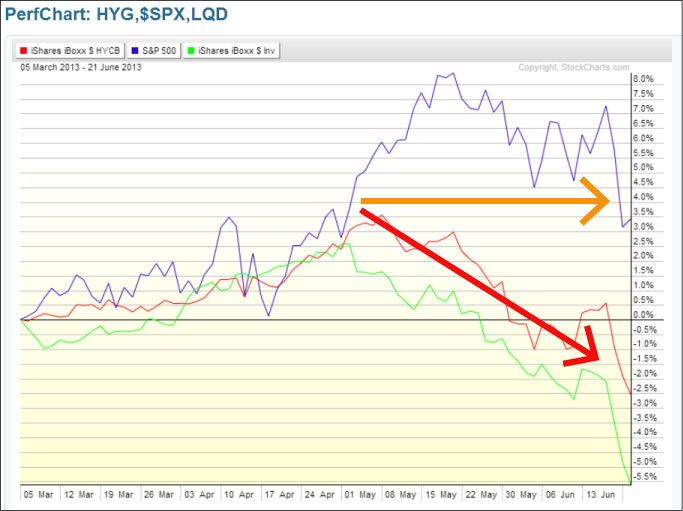
Bond markets have also been flashing warning signs. The chart below represents a high correlation period between the HYG and LQD etf's, and the S&P 500, which act as good proxies for risk appetite especially. Beginning in early May there is a clear divergence between the stock market and bonds.

Perfchart


Couple these factors together and it appears that we have entered a correction phase in asset markets, as some of the “froth” gets wiped away and the players reposition themselves. In future posts I will examine the linkages between shadow banking system, the players involved and the necessity of deleveraging. I will also look for the signal that gave investors the go ahead to get risky in the last round of forced deleveraging.

Who Runs the Market? The High Stakes Players

Approximately $7.5 trillion in assets are controlled by 24 private financial entities. This list does not include central banks and governments. These numbers are subject to differences in estimations and definitions of AUM but it provides a nice ball park figure to let you know the influence these players have on the market.  

Two Lists:

Primary Dealers AUM in Billions
Cantor Fitzgerald & Co. Not disclosed
Merrill Lynch, Pierce, Fenner & Smith Incorporated $1,800.0
Deutsche Bank Securities Inc. $1,245.6
Goldman, Sachs & Co. $748.1
BNP Paribas Securities Corp. $676.9
UBS Securities LLC. $632.0
Credit Suisse Securities (USA) LLC $439.8
HSBC Securities (USA) Inc. $417.0
Morgan Stanley & Co. LLC $341.0
RBC Capital Markets, LLC $280.0
Mizuho Securities USA Inc. $133.9
SG Americas Securities, LLC $115.8
Bank of Nova Scotia, New York Agency $115.0
Citigroup Global Markets Inc. $31.7
J.P. Morgan Securities LLC $26.5
Nomura Securities International, Inc. $24.8
RBS Securities Inc. $20.0
Barclays Capital Inc. $16.9
BMO Capital Markets Corp. $15.5
Daiwa Capital Markets America Inc. $12.6
Jefferies LLC $2.0
Total $7,095.1


Hedge Funds AUM in Billions
Bridgewater Associates $77.6
Man Group $64.5
JPMorgan Asset Management $46.6
Brevan Howard Asset Management $36.6
Och-Ziff Capital Management Group $28.5
Paulson & Co. $28.0
BlackRock Advisors $27.7
Winton Capital Management $27.0
Highbridge Capital Management $26.1
BlueCrest Capital Management $25.0
Baupost Group $23.0
Cerberus Capital Management $23.0
D.E. Shaw & Co. $23.0
Angelo Gordon Co. $22.0
AQR Capital Management $20.5
Total $499.1

When these behemoths have to move, much like an earthquake in the middle of the ocean, to those miles and miles away it goes unnoticed; but the reverberations become Tsunami's that obliterate unprepared portfolios. An investor must be vigilant, always looking out for tremors.

A final perspective. 183 countries reported 2011 GDP$USD figures to the World Bank. The total assets of these 24 private entities is larger than the GDP of 150 of those reporting countries combined.


photoshopped1

WHO RUNS THE MARKET?

trading-desk.jpg

A simple question, often overlooked to the investors' detriment.... In my ongoing pursuit to gain an edge in the market I’ve often thought it critical to analyze who the key players are. But even more broadly and perhaps of greater importance, I’ve often considered who or what forces have the power to “move the markets”. As a casual observer, or "unsophisticated" investor the most common market news you may encounter is pundits discussing stocks and the stock market, earnings reports, the FED and various economic indicators. The layman could hardly be blamed for thinking the stock market is the most influential economic market in the U.S. if not the world. Consider the enormous amount of attention that is given daily to the U.S. stock market. How critical it was and continues to be for the FED and government decision makers to consider “the market” in their decision making.

Here exists the ironic, easily obscured truth. When the FED and key shot callers reference “the market” most investors immediately think  "the stock market". I used to be guilty of this myself, but it is not only a serious error but also a limiting thought process.  Consider why? The equity market is in actuality the smallest of the actively traded markets. Let’s examine the data and the importance of this analysis will become  clearer.

According to 2012 World Bank data, global equities had a market value of approximately $53 trillion current USD. The Bureau for International Settlements (BIS) quarterly data approximates Total global debt securities at $86.6 trillion. That’s over 1 and a half times the market value of all equities. The BIS Triennial 2010 survey, reported the foreign exchange (Forex) market had an OTC notional value of $63 trillion in total contracts. Total OTC derivatives accounted for $632 trillion in outstanding contract values. That’s 12x the size of the global equity market.

Global Markets Securities Size

 Average daily trading volume (ADTV) also helps tell the story.

ADTV

Forex trading has the largest ADTV followed by U.S. debt securities, then global interest rate derivatives. Examining the ratios; Forex trading volume is almost 19x larger than U.S. equity market volume; U.S. debt securities 4.2x larger and interest rate derivatives are 3.4x larger.

Bottom-line, U.S. equities account for the smallest piece of the asset market pie, both in market value and average daily trading activity.

The implications cannot be overstated. The “market” is a huge web of interconnected asset classes arranged in a hierarchical order with U.S. equities located at the bottom. Equities serve as both an expression of market expectations on real economic output; and of the volatility occurring across all interest rate based securities.

Examining these larger securities’ markets can provide indicators to actionable trading ideas. The leverage and capital at risk is so large in these markets, significant, far reaching dislocations can occur as a result of something conceptually “simple”, like an interest rate hike or a currency peg. These events blow holes in the efficient market hypothesis and allow for astute traders to place favorable bets with asymmetrical risk-reward properties.

This subject will be an ongoing topic of discussion and analysis, as these events typically increase emotional intensity and therefore volatility. The extremes in emotions present the greatest opportunities for the prepared and courageous investor.


Chipotle Mexican Grill (CMG)_Part 2

Chipotle-expensive-burrito-e1368315854468.png

Early January 2013, I did a write-up of Chipotle Mexican Grill and my thoughts on its value and whether I would buy it at that level for a long term investment. Based on my initial analysis I concluded that CMG was expensive as a growth company due to several factors. Data trends indicated that operating margins and revenue growth (while still growing) were beginning to level off. Additionally, earnings surprise momentum showed a negative trend indicating positive earnings surprises were less frequent and of decreasing magnitude.  Also, the fast-casual food segment is growing but chipotle doesn’t have a stranglehold on the Mexican food niche with competitors such as Qdoba, Del Taco, Taco Bell, Baja Fresh, among others all competing for market share with generally indistinguishable menu items. Again I concluded it was an expensive buy at the time. Let’s reexamine my thesis by analyzing the following points: Earnings growth/momentum, location growth and market share, same store sales, and Revenue, NI, Ebit growth and margins.

Income Statement growth and Margins

Comparing updated year end statement revenue, EBIT, and NI growth I find that my expectations were in line in that CMG’s “growth” phase is stabilizing towards long term sustainable growth rates. I would like to qualify my previous statement and expand on my meaning.

Year over year: CMG’s revenue changed from $2.27 billion to 2.73 billion, a 20+% increase; EBIT from 351 million to 456 million, a 30% increase, and net income from 215 million to 278 million, a 29+% increase. These are definitely in growth company territory and far above sustainable growth trends. My concern was this high level of income growth was showing signs of stabilization and in some cases decline. Let’s examine the updated growth charts.

revexp growth yoy Ebit NI growth Log


A cursory glance at these graphs shows a clear downward trend. Again this is not alarming in absolute terms but relative to prior periods it supports my thesis of a growth company moving towards stability. Ebit and Net income growth have shown decreasing volatility. Let’s now look at margin trends.

Ebit Ni margin trend Margin Growth Yoy

Margins clearly aren’t growing in as explosive a fashion when examined in context of the previous decade lending support to my thesis of stabilizing financial metrics.

Location growth and same store sales

Location growth has been consistent over the last few years averaging ~16% per year. According to the 2012 10K the majority of their revenue growth is attributable to menu price increases in and 7.1% same store sales growth Yoy. That figure is down from 11.2% in 2011. Average restaurant sales increased 5% Yoy a decline from 9.4% in 2011…

Now for my favorite-

EPS growth and momentum

Now we get to the meat of the discussion. Examining quarterly EPS growth, EPS absolute value, and momentum (earnings surprise) we can see more evidence of financial stabilization and some trend decline. I believe a picture is worth a thousand words. Data is sourced from earnings.com a Thomson Reuters site.

EPS by qtr


Notice that EPS has increased rather steadily, however since Q1 2011 earnings have remained range bound…

EPS qtrly growth


EPS growth is showing high variability q/q and the linear trendline has a negative slope.


earnings surprise

Here we see earnings momentum is trending downward over the last few years. Good thing Chipotle has been consistent at minimum meeting consensus estimates. The magnitude of positive surprises has also declined.


While writing this blog I came to another more practical conclusion about the strength of earnings and the stock value appreciation. The fast-casual segment of restaurants is growing at above GDP trend rates and faster than the restaurant segment as a whole. It’s arguable that the Mexican niche is the most popular outside of traditional burger joints. However, the majority of the competitors in this niche are privately owned or owned by a larger diversified conglomerates. There is only one major company that allows for investors to make a pure play on this segment and that’s CMG. There are much worse companies to invest in. Consider if you’re a Portfolio Manager looking for an investment vehicle to gain exposure to this niche, who better than CMG? It dwarfs the majority of its competitors in size and revenues while maintaining a strong balance sheet and operating in a cash business with low debt. Not only that, but If you believe the positive macroeconomic headlines, CMG stands to benefit as more people gain employment via their convenience as a lunch time venue. This would definitely help explain the market beating returns CMG has posted this year. YTD CMG has outperformed the SP500 by 11.23% and is up an overall 24%.


Exposure_Lights_02

Chipotle Mexican Grill (CMG)_Part 1

Chipotle-expensive-burrito-e1368315854468.png

Here is a presentation I produced in early January, where I evaluated the value of buying Chipotle (CMG) stock as a long term investment. It is here for reference for my follow up post in which I update my thesis.  Check it out. As always feedback is welcomed.