

COMPOSITE MACRO ETF WEEKLY ANALYTICS (1/02/2016)
/LAYOUT (Organized by Time Period):
Composite ETF Cumulative Returns Momentum Bar plot
Composite ETF Cumulative Returns Line plot
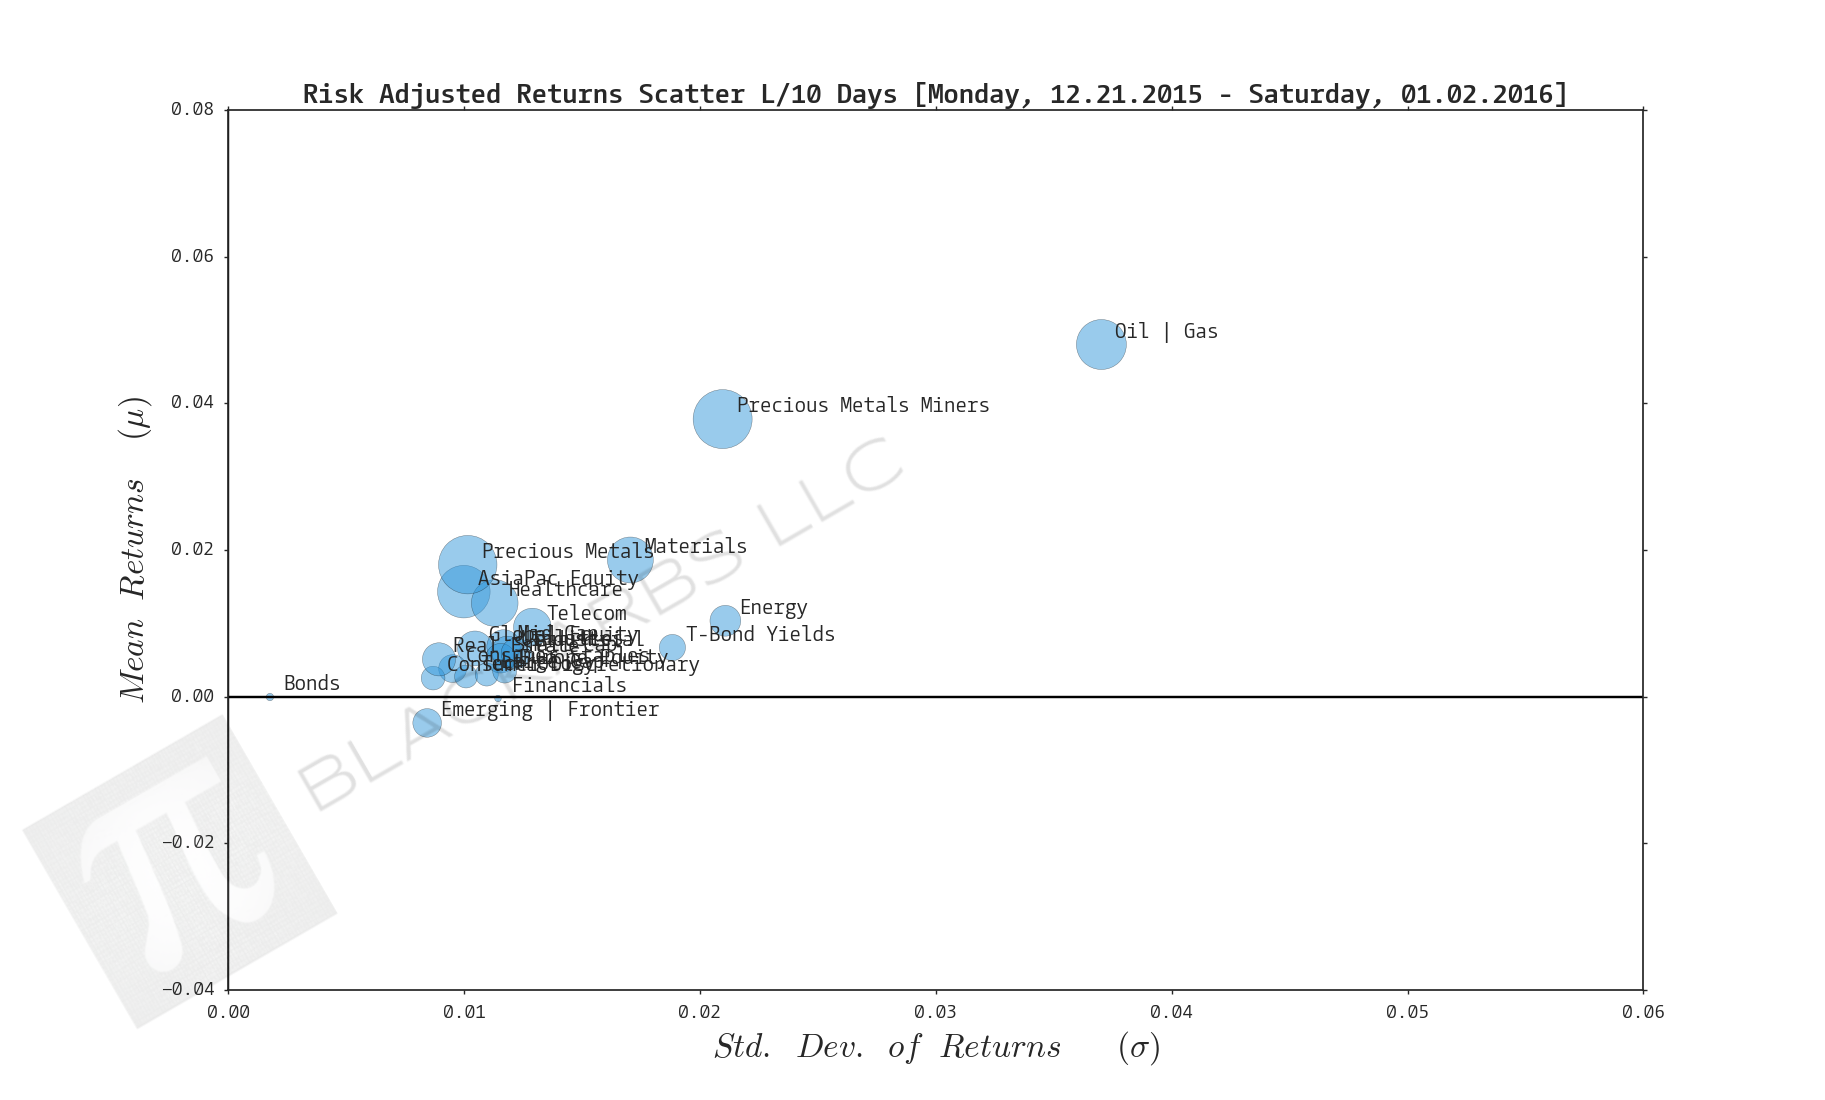
Composite ETF Risk-Adjusted Returns Scatter plot (Std vs Mean)
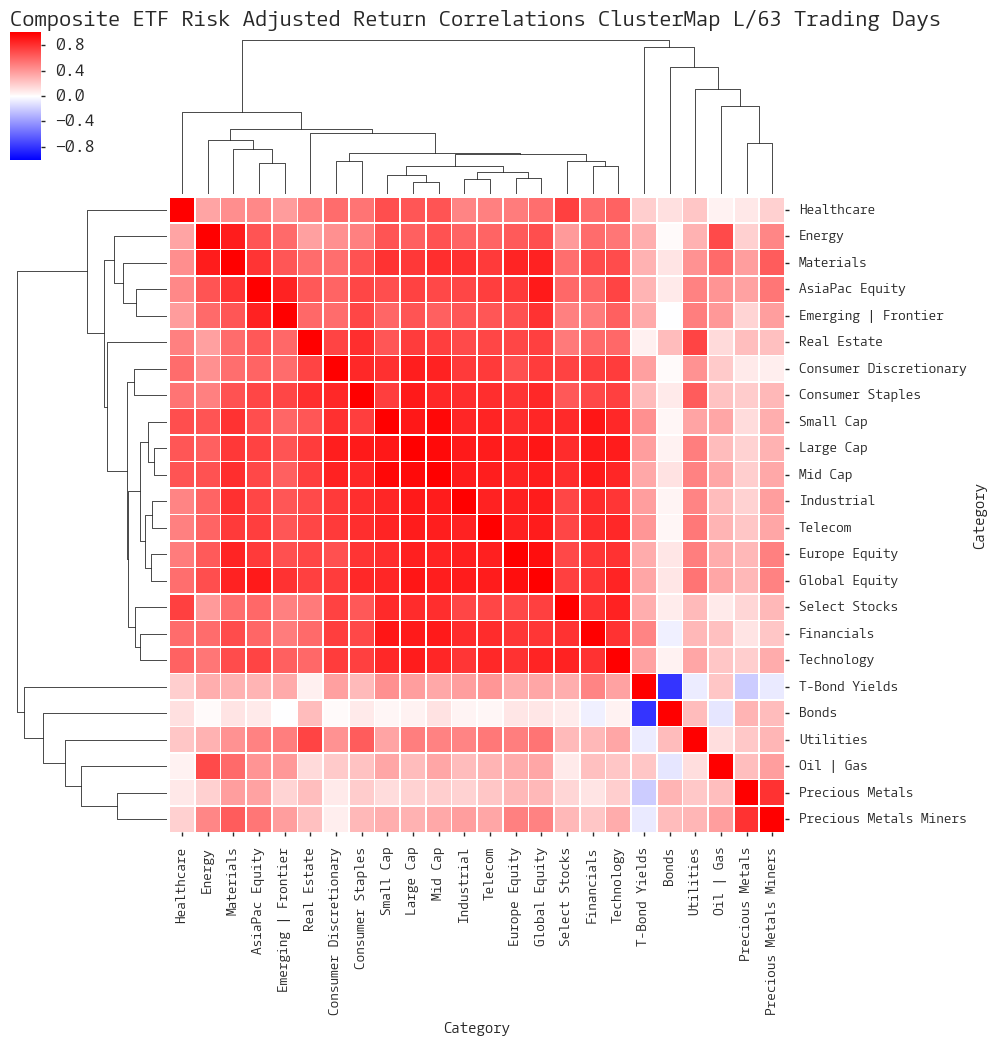
Composite ETF Risk-Adjusted Return Correlations Heatmap (Clusterplot)
Composite ETF Cumulative Return Tables
Notable Trends and Observations
COMPOSITE ETF COMPONENTS:
LAST 252 TRADING DAYS


LAST 126 TRADING DAYS


LAST 63 TRADING DAYS


LAST 21 TRADING DAYS


LAST 10 TRADING DAYS


Cumulative Return Tables:
Notable Observations and Trends:
- T-Bond Yields have positive cumulative returns on all time frames. This appears to be a one way trade given the prior belief and subsequent start of rate tightening by the Federal Reserve.
- As noted last week, Oil + Gas and Precious Metals Miners may be experiencing a bit of a relief rally as traders/investors cash in on their short plays and/or try to time a bottom.
- Examining the Scatter plots over the last 252 days Healthcare is the best risk-adjusted composite and it's not even close.
- Interesting to note the Small Caps composite makes an appearance on the bottom 3 worst performers over the last 21 days.
