

COMPOSITE MACRO ETF WEEKLY ANALYTICS (12/19/2015)
/LAYOUT (Organized by Time Period):
Composite ETF Cumulative Returns Momentum Bar plot
Composite ETF Cumulative Returns Line plot
Composite ETF Risk-Adjusted Returns Scatter plot (Std vs Mean)
Composite ETF Risk-Adjusted Return Correlations Heatmap (Clusterplot)
Composite ETF Cumulative Return Tables
Notable Trends and Observations
COMPOSITE ETF COMPONENTS:

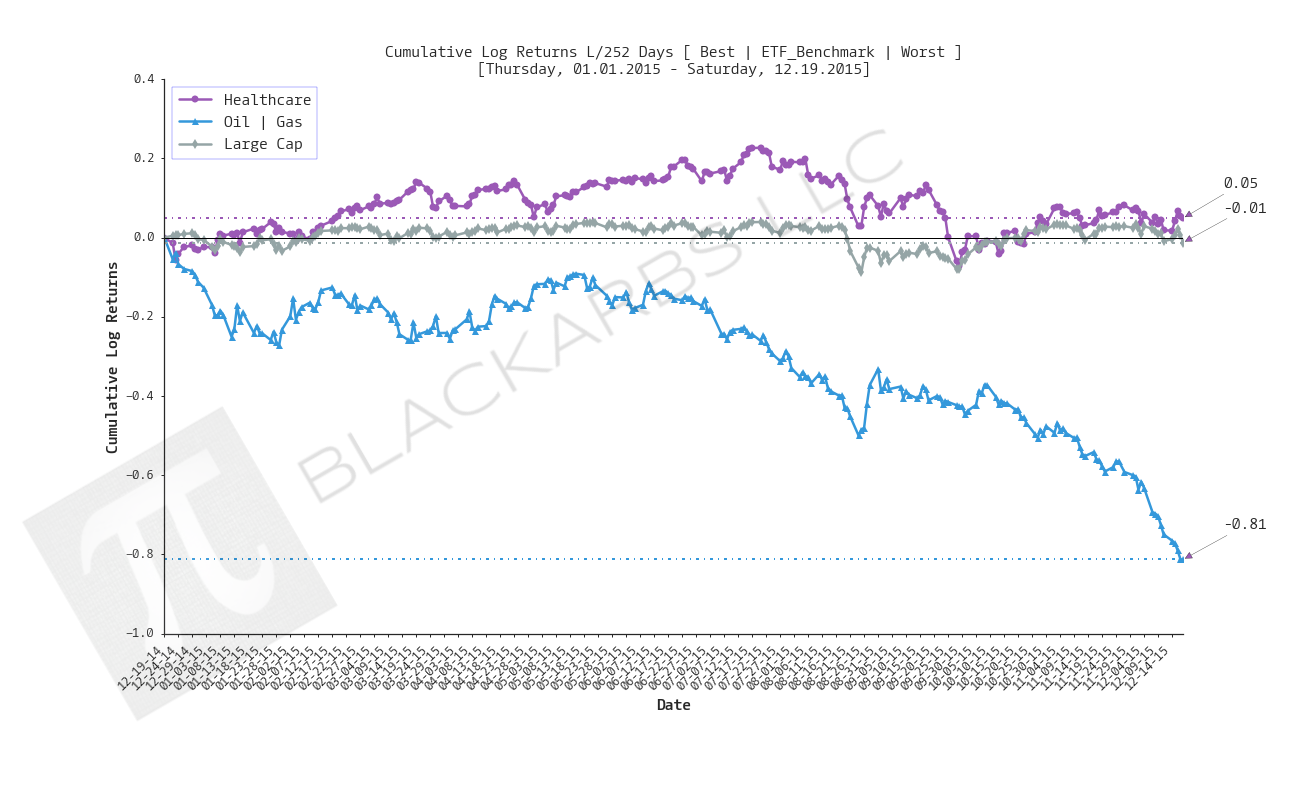
LAST 252 TRADING DAYS


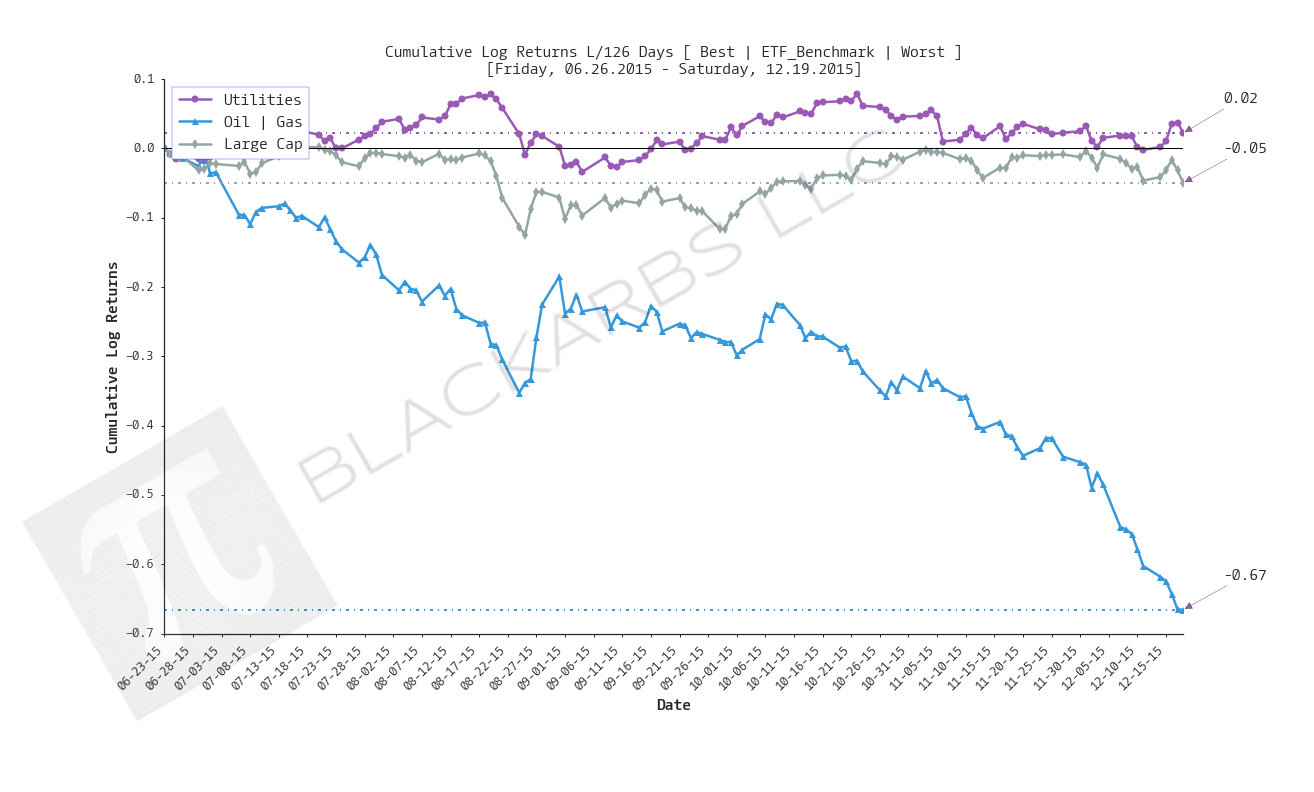
LAST 126 TRADING DAYS


LAST 63 TRADING DAYS


LAST 21 TRADING DAYS


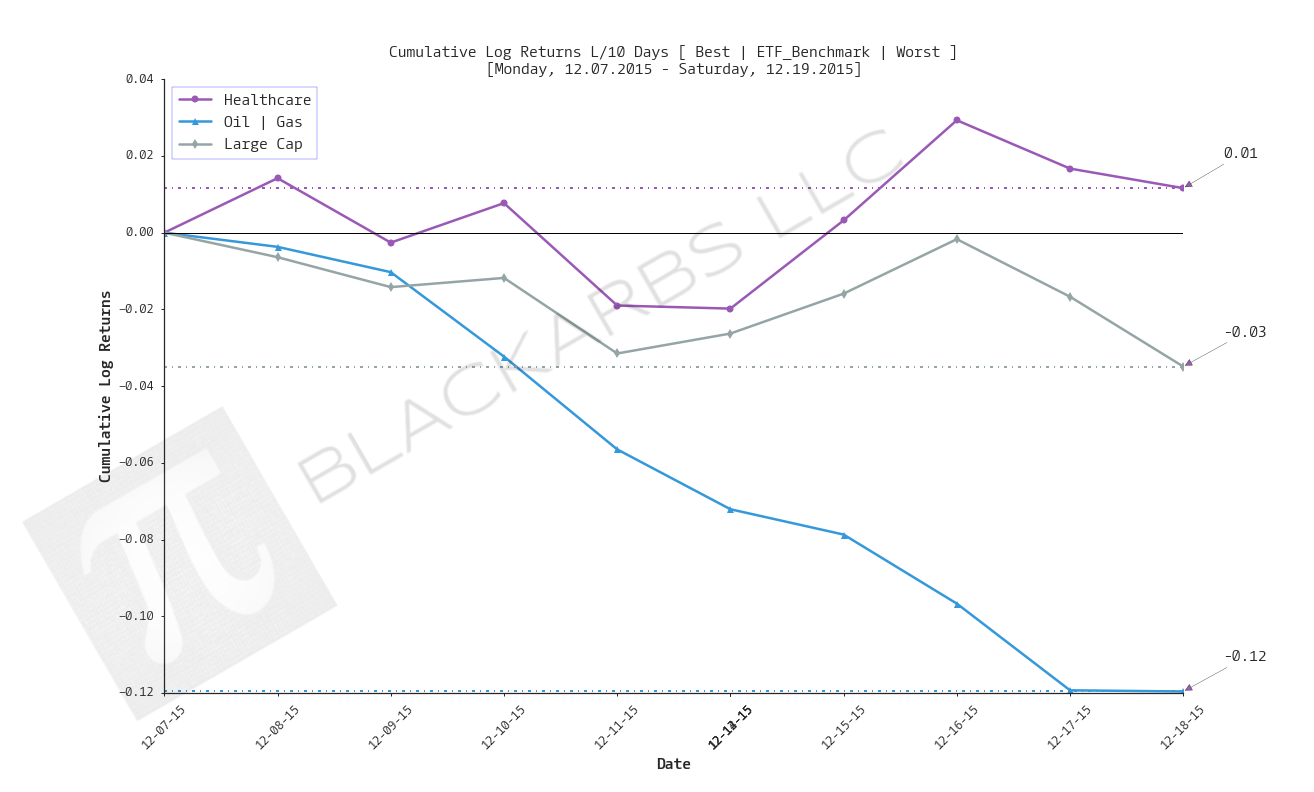
LAST 10 TRADING DAYS


Cumulative Return Tables:
Notable Observations and Trends:
- The Healthcare composite has shown the most durable positive, relative performance of the groups. It has been a top 3 performer over the last 252, 21, 10 trading day periods.
- Over the last 63 trading days Treasury bond yields have been the number 1 performer. If Treasury yields continue to outperform, it's likely that any selloff in equities will reverse course.
- Energy and Oil + Gas continue to underperform across time periods with no end in sight.
- Precious Metals Miners are also hurting over the last 252, 126 and 63 day time frames. I wonder if, at some point a bullish case could be made given that their largest input (Oil and Gas) continue to decline in price.
- It's interesting that over the last 21 trading day period there were no composite groups with positive cumulative returns.
