

COMPOSITE MACRO ETF WEEKLY ANALYTICS (1/30/2016)
/LAYOUT (Organized by Time Period):
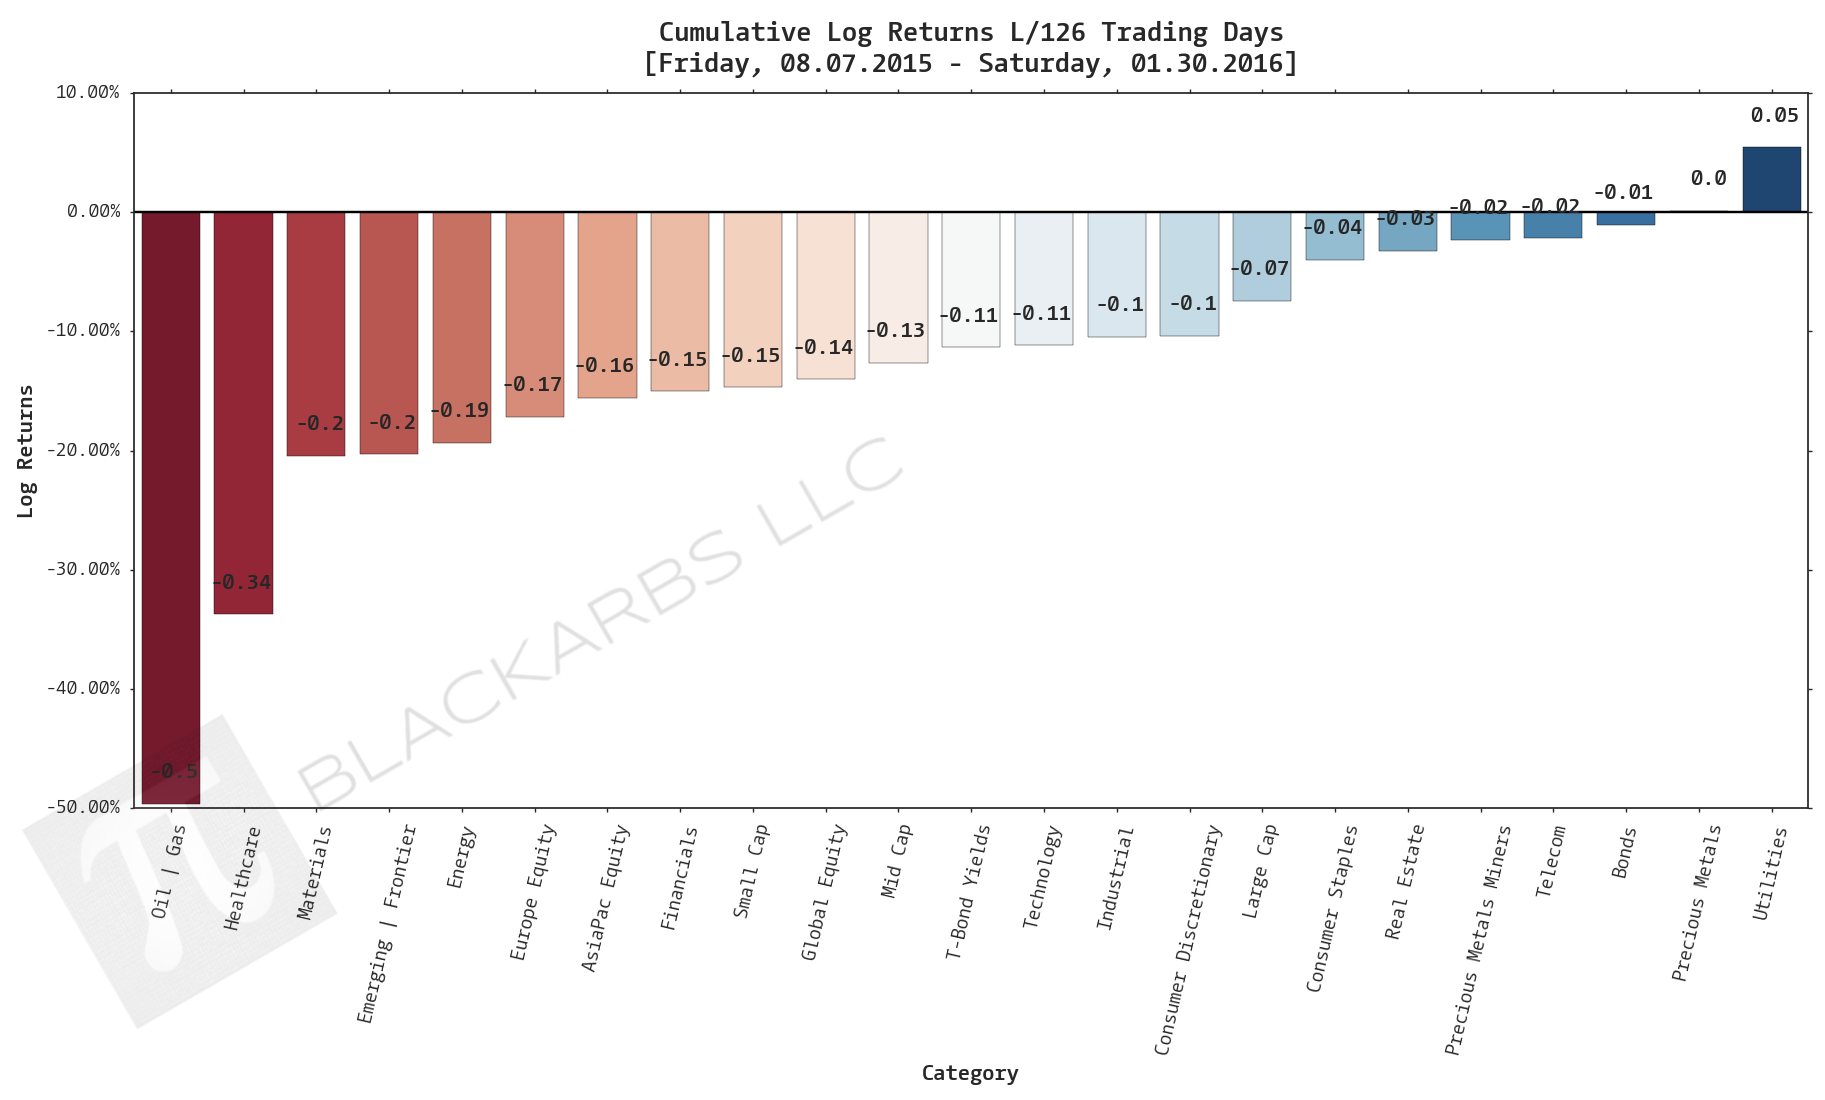
Composite ETF Cumulative Returns Momentum Bar plot
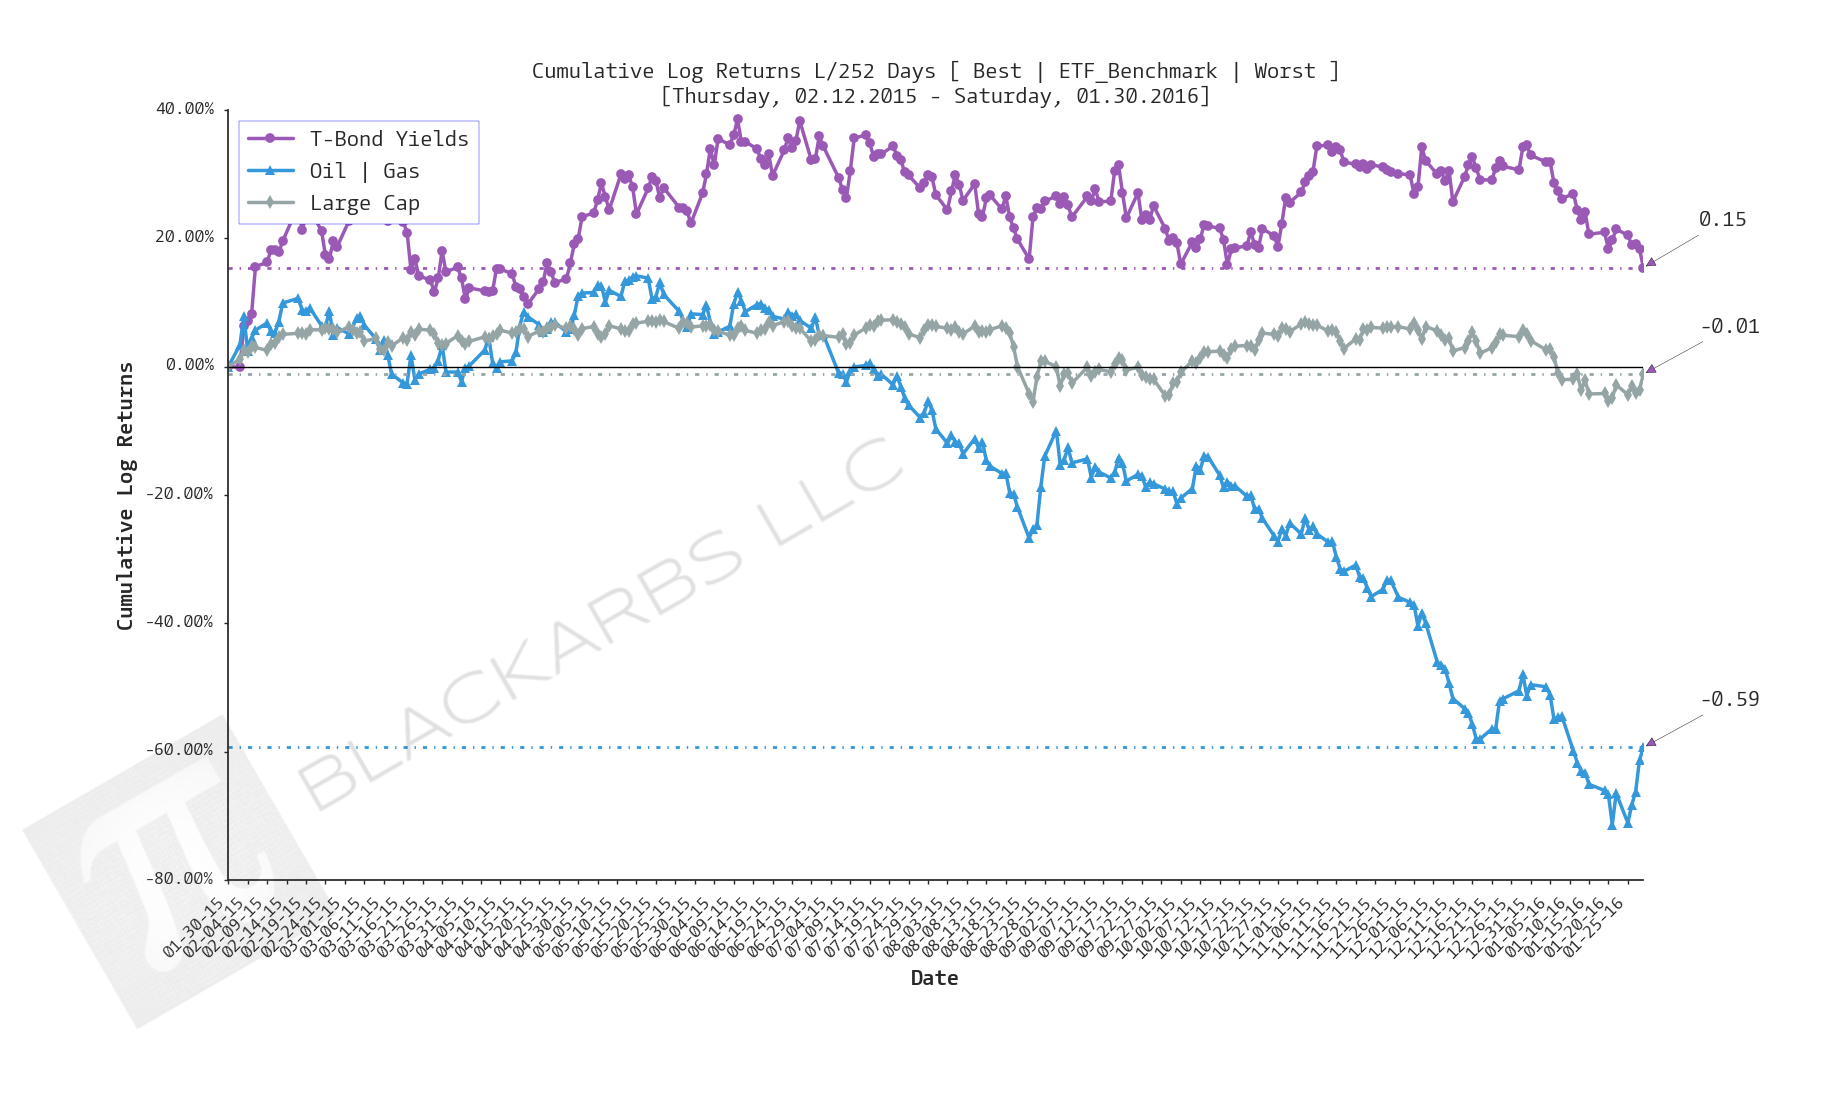
Composite ETF Cumulative Returns Line plot
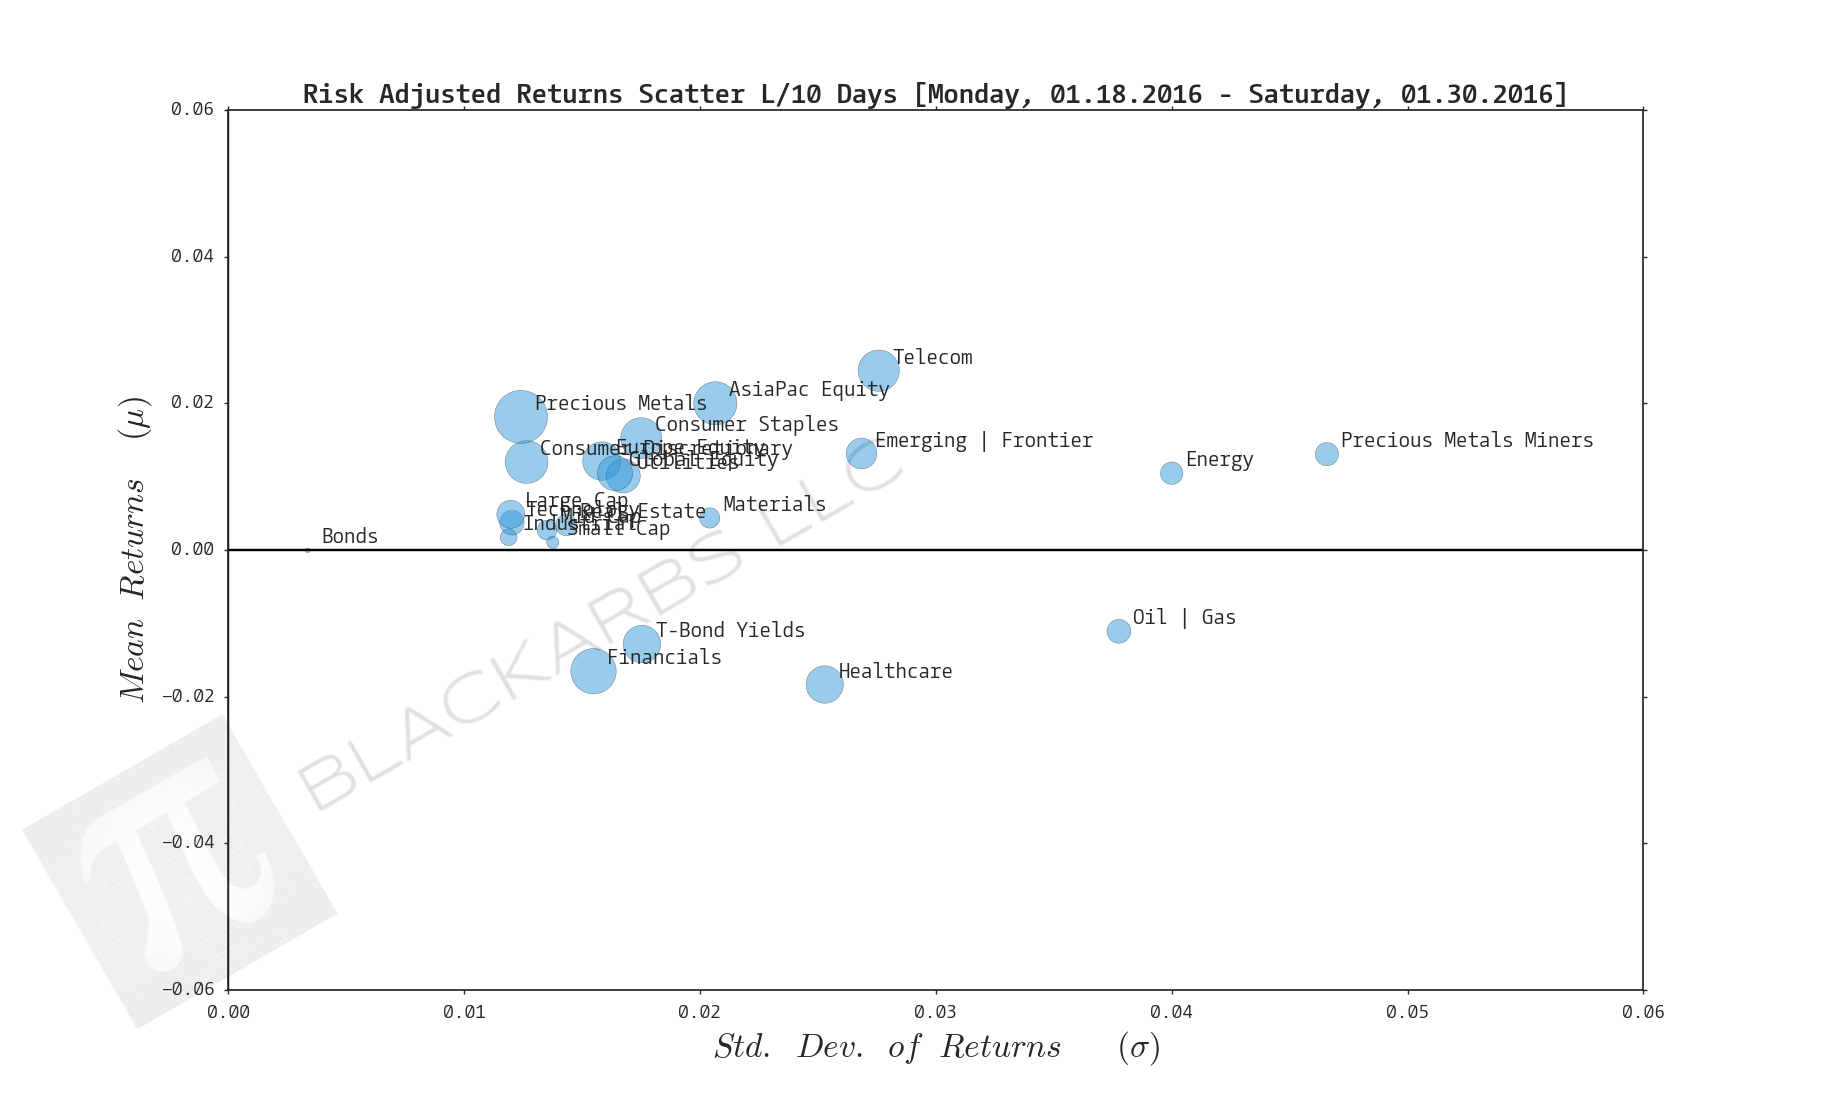
Composite ETF Risk-Adjusted Returns Scatter plot (Std vs Mean)
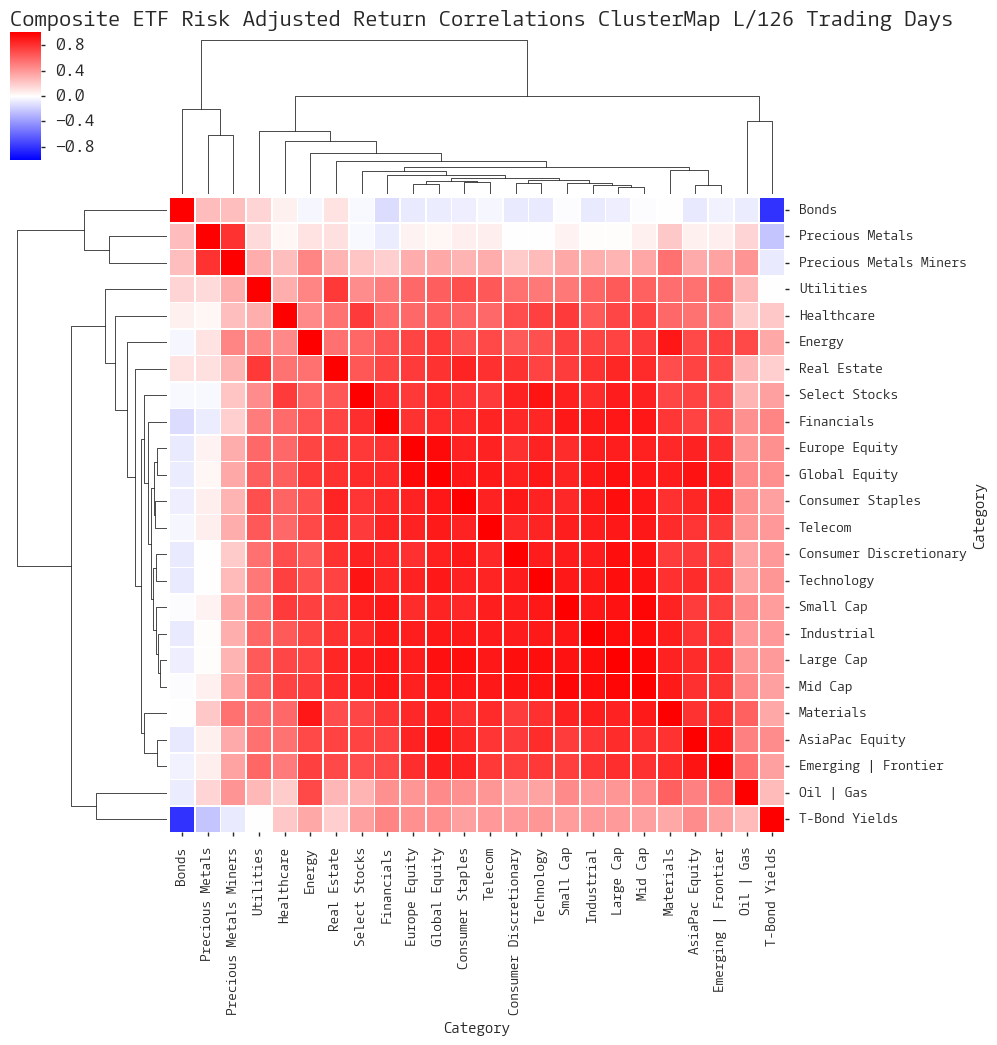
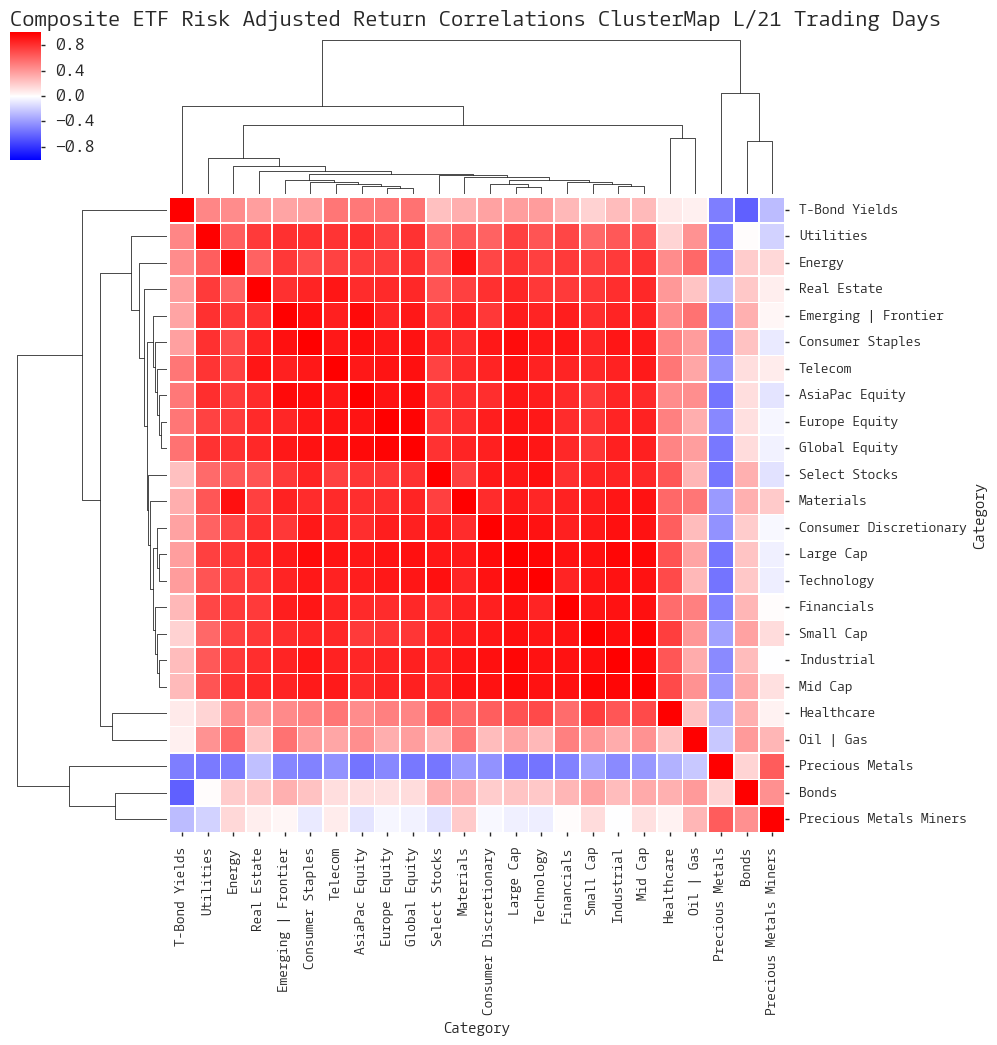
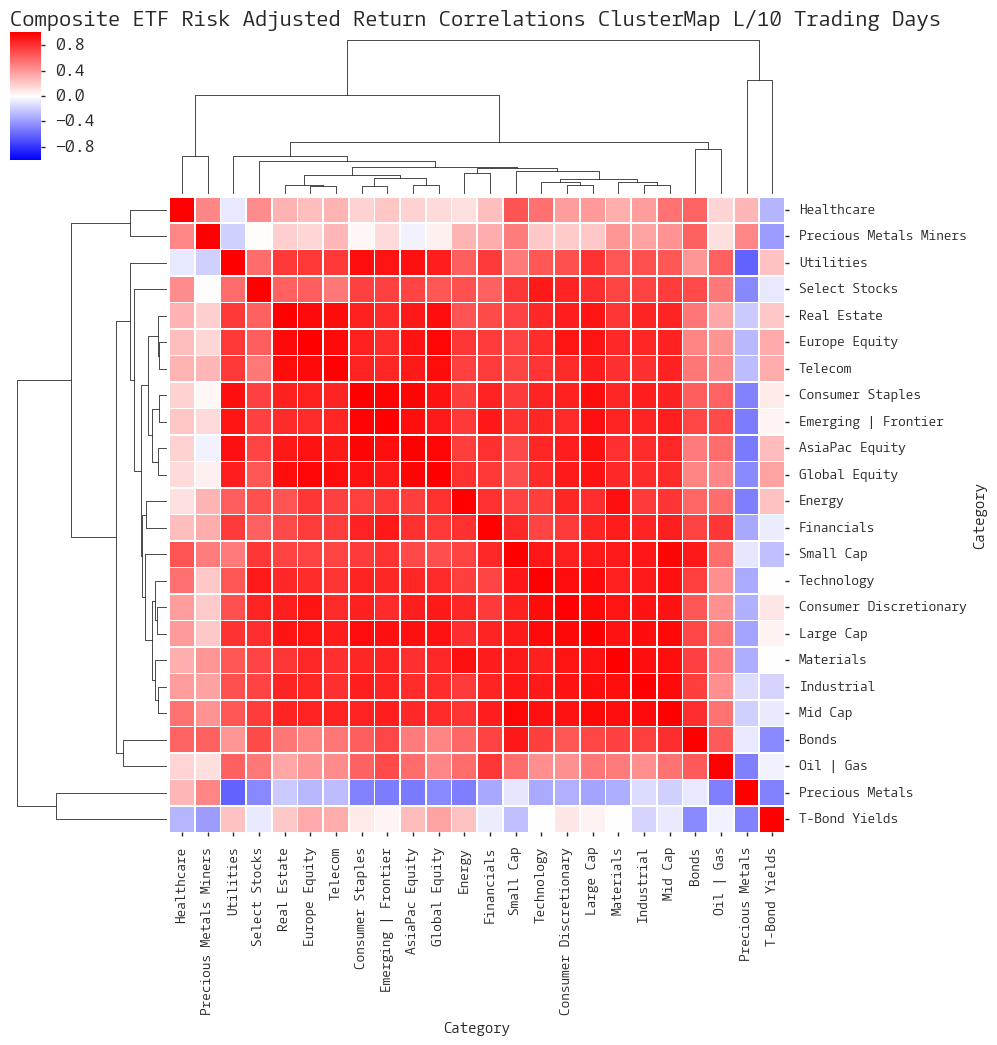
Composite ETF Risk-Adjusted Return Correlations Heatmap (Clusterplot)
Composite ETF Cumulative Return Tables
Notable Trends and Observations
COMPOSITE ETF COMPONENTS:
LAST 252 TRADING DAYS


LAST 126 TRADING DAYS


LAST 63 TRADING DAYS


LAST 21 TRADING DAYS


LAST 10 TRADING DAYS


Cumulative Return Tables:
Notable Observations and Trends:
- Last 10 days provides strong evidence of a relief rally as all but 2 composites showed positive cumulative gains. Further evidence is the leadership group comprised of Energy, Precious Metals Miners, and Emerging/Frontier which had been heavily oversold on a long and medium term basis.
- Additionally over the Last 10 days one of the worst 3 performers (Bonds) had positive performance.
- Telecom has emerged as a composite to watch being one of the top 3 performers over the last 252 days. Perhaps it is the new safe haven asset class as it has been a top 5 performer on all time frames under study.
- Telecom has also been a strong performer on a risk-adjusted basis seemingly hugging the belly of the efficient frontier, near or above zero, across all time frames.
