

COMPOSITE MACRO ETF WEEKLY ANALYTICS (4/17/2016)
/FOR A DEEPER DIVE INTO ETF PERFORMANCE AND RELATIVE VALUE SUBSCRIBE TO THE ETF INTERNAL ANALYTICS PACKAGE HERE
LAYOUT (Organized by Time Period):
Composite ETF Cumulative Returns Momentum Bar plot
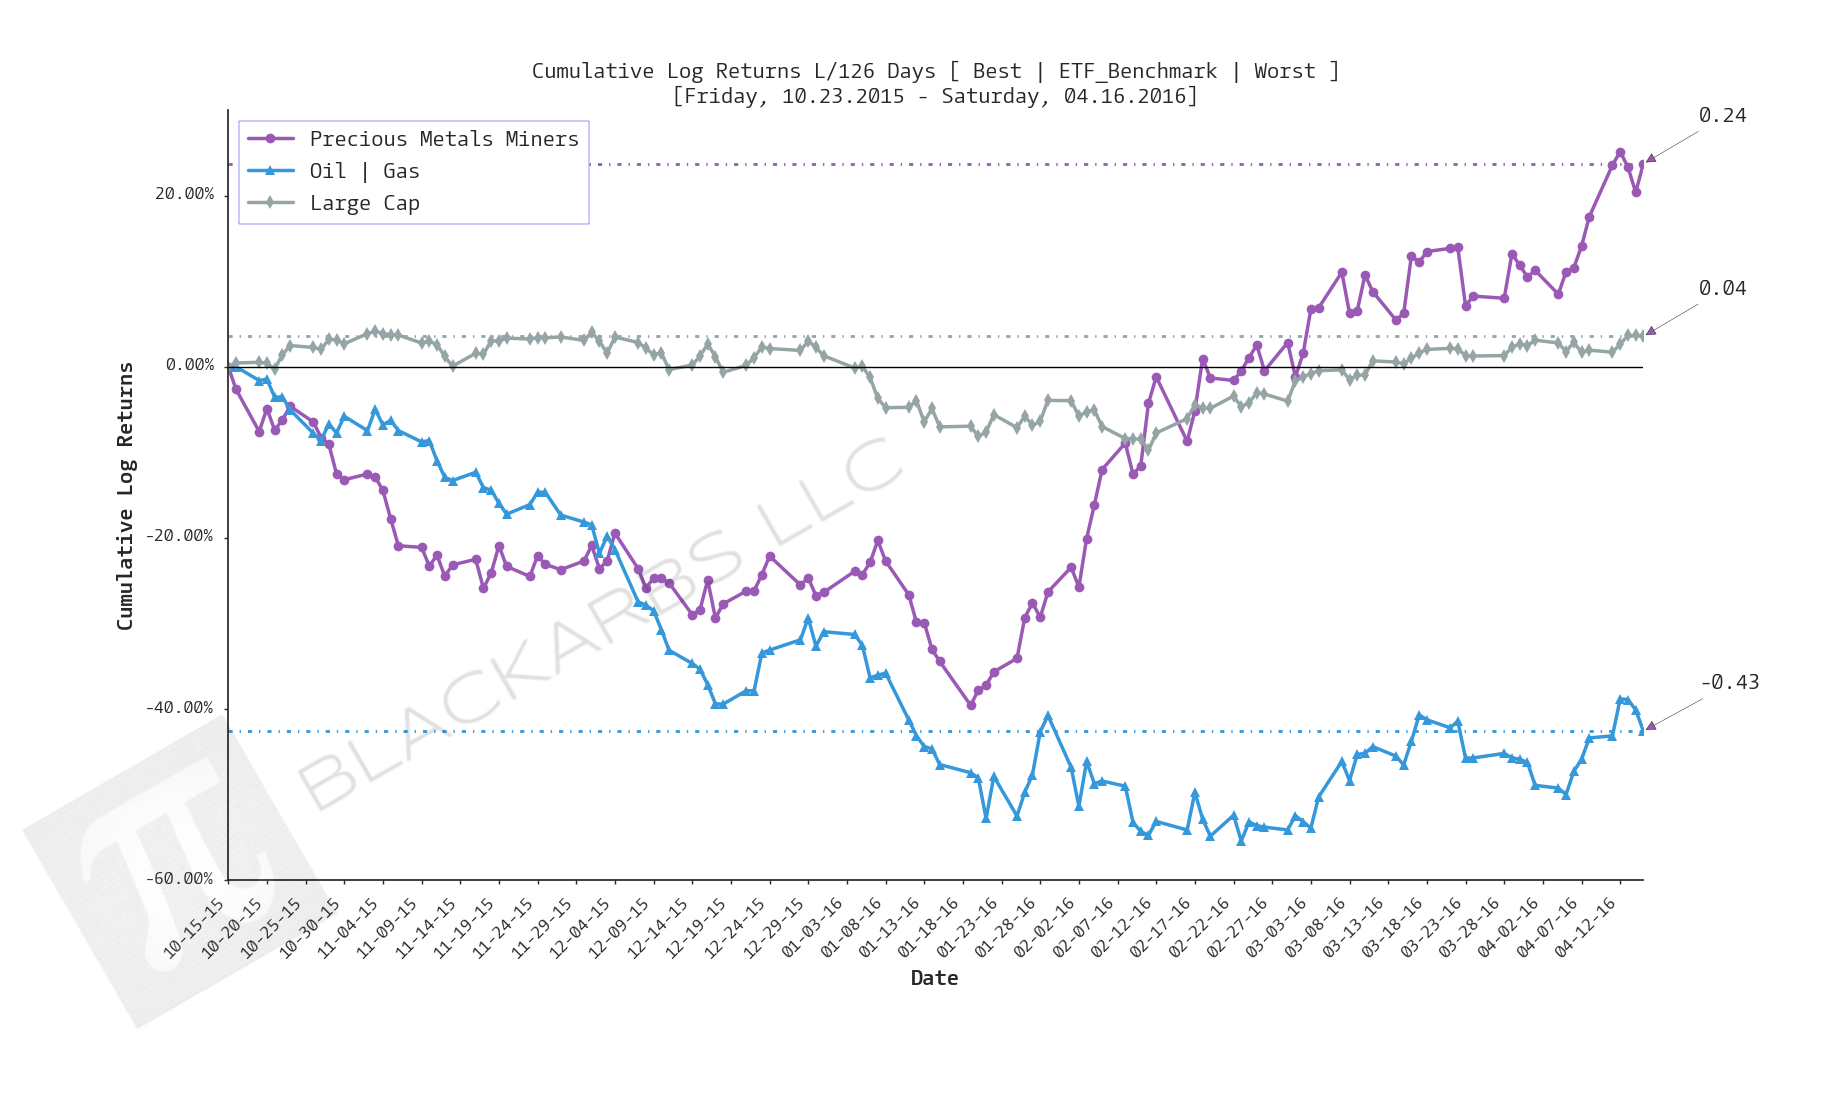
Composite ETF Cumulative Returns Line plot (best vs worst vs benchmark)
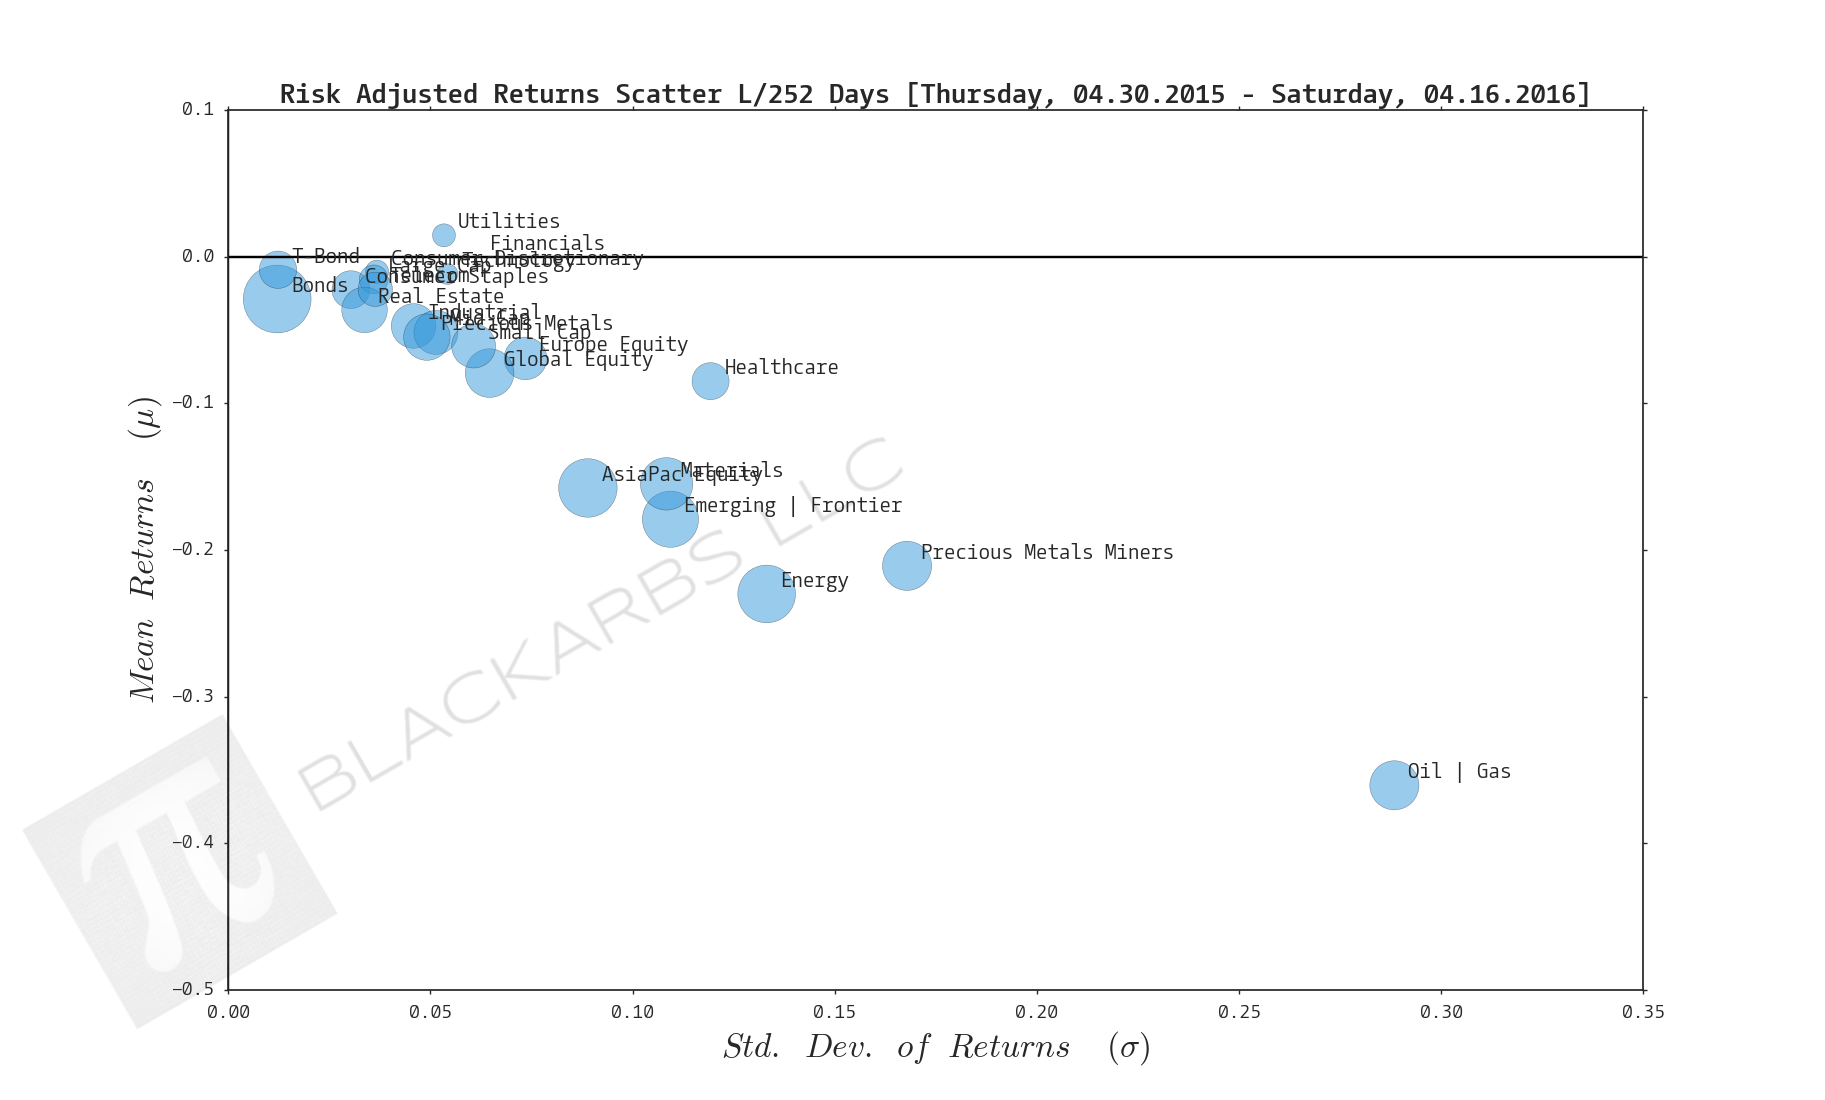
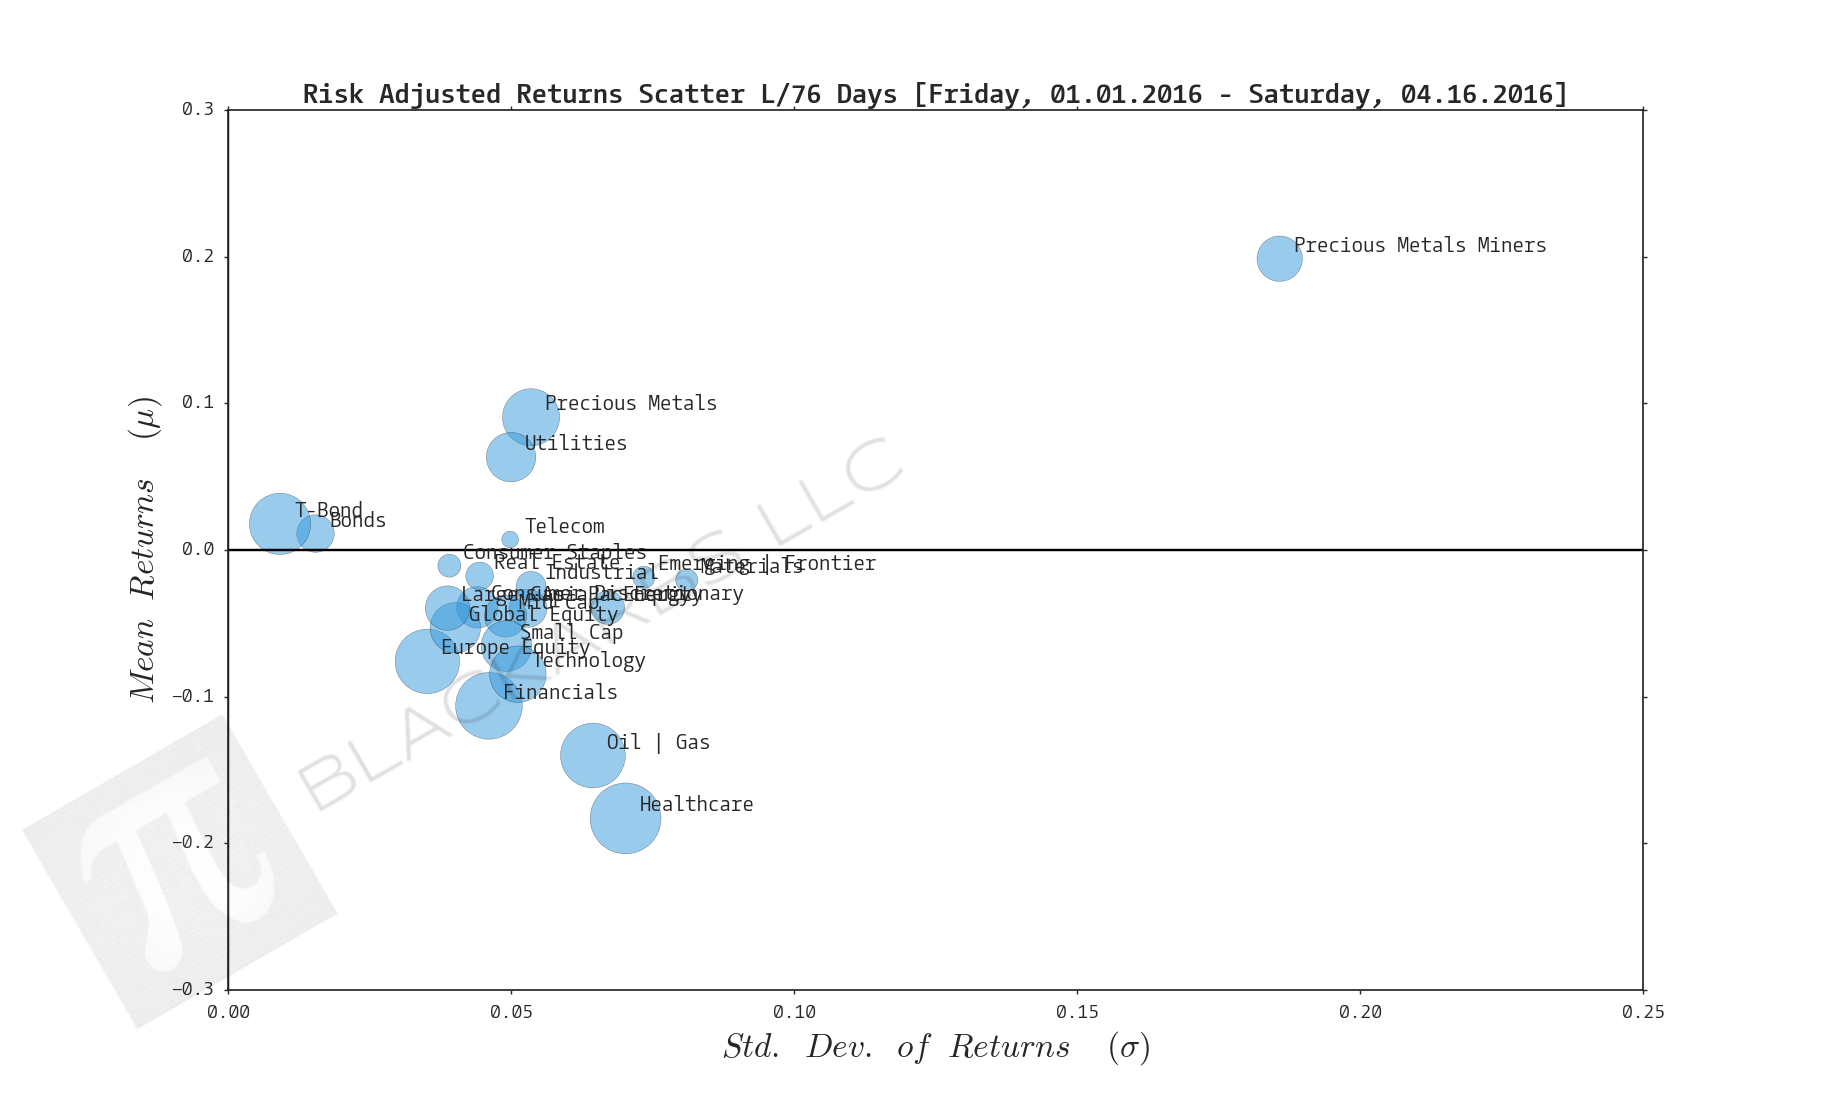
Composite ETF Risk-Adjusted Returns Scatter plot (Std vs Mean)
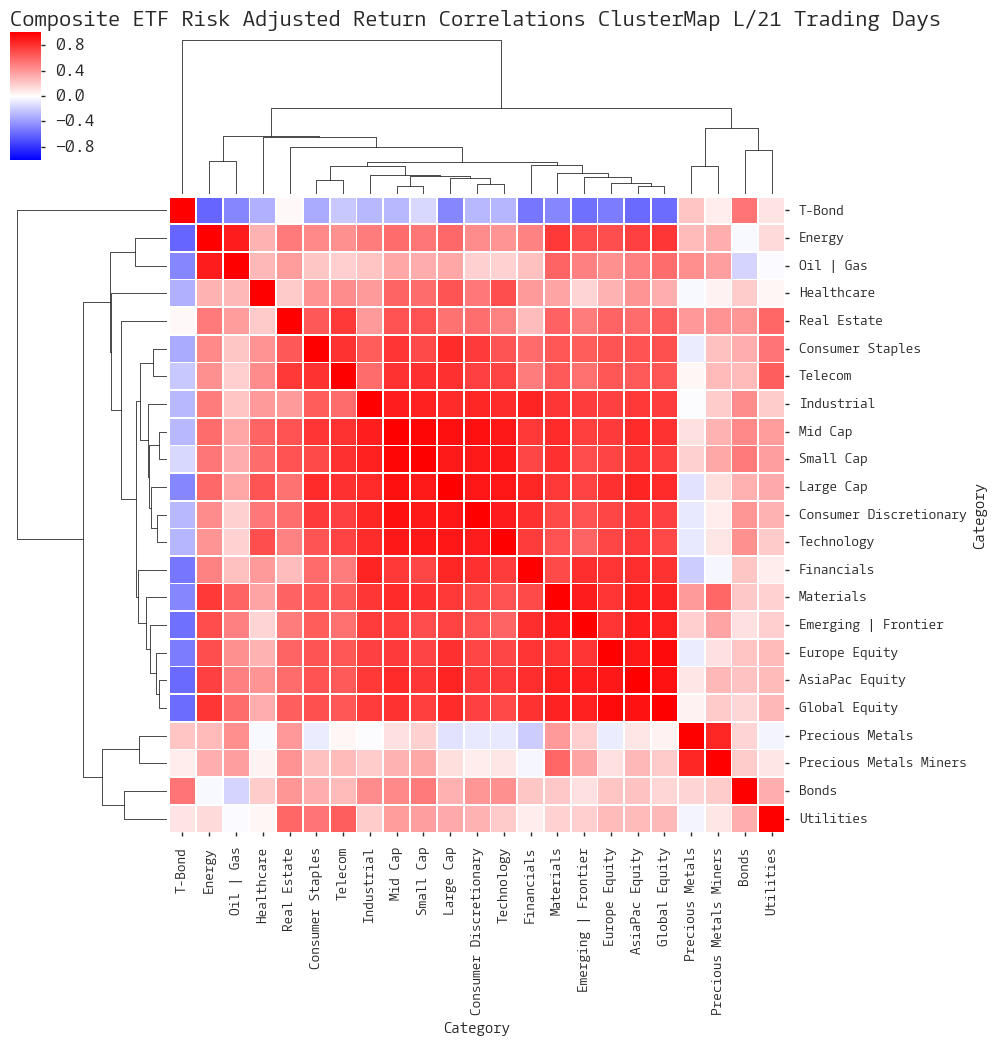
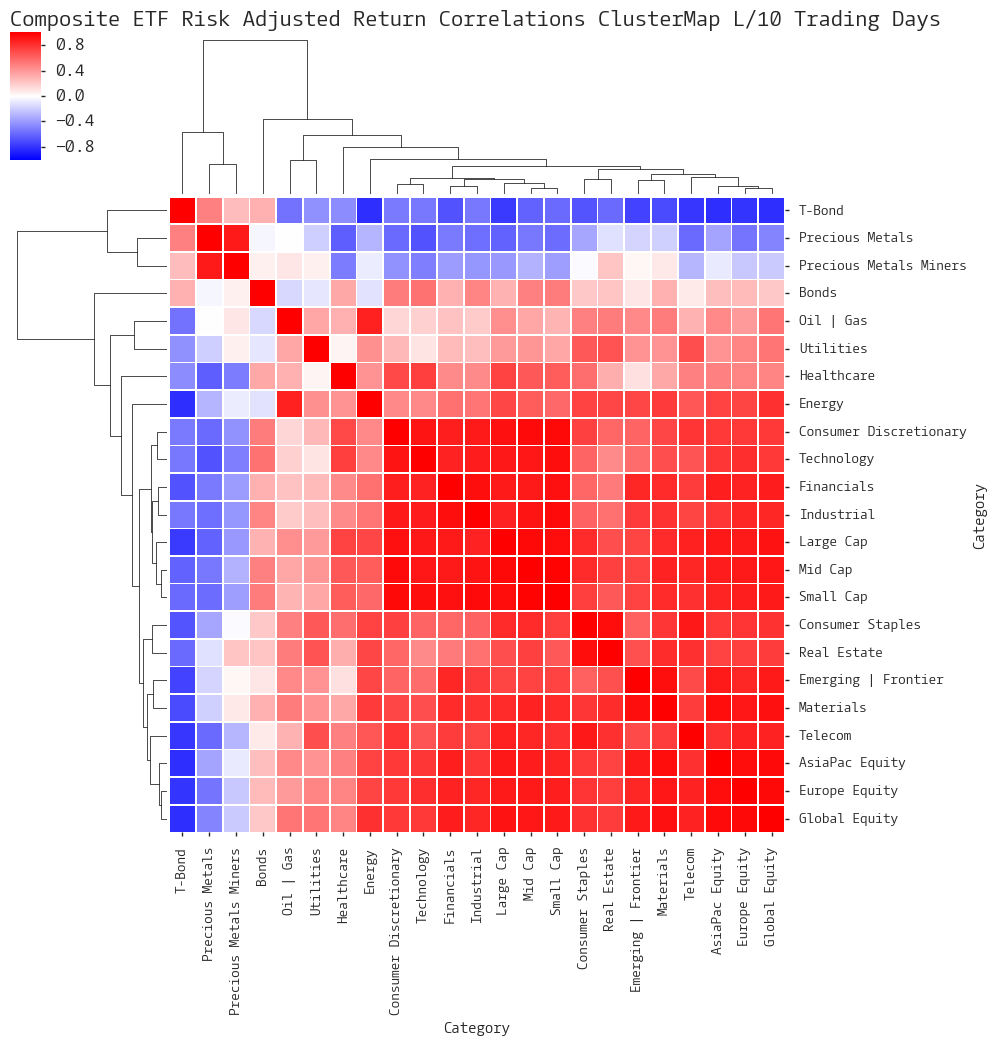
Composite ETF Risk-Adjusted Return Correlations Heatmap (Clusterplot)
Implied Cost of Capital Estimates
Composite ETF Cumulative Return Tables
Notable Trends and Observations
COMPOSITE ETF COMPONENTS:
LAST 252 TRADING DAYS


LAST 126 TRADING DAYS


Ytd LAST 76 TRADING DAYS


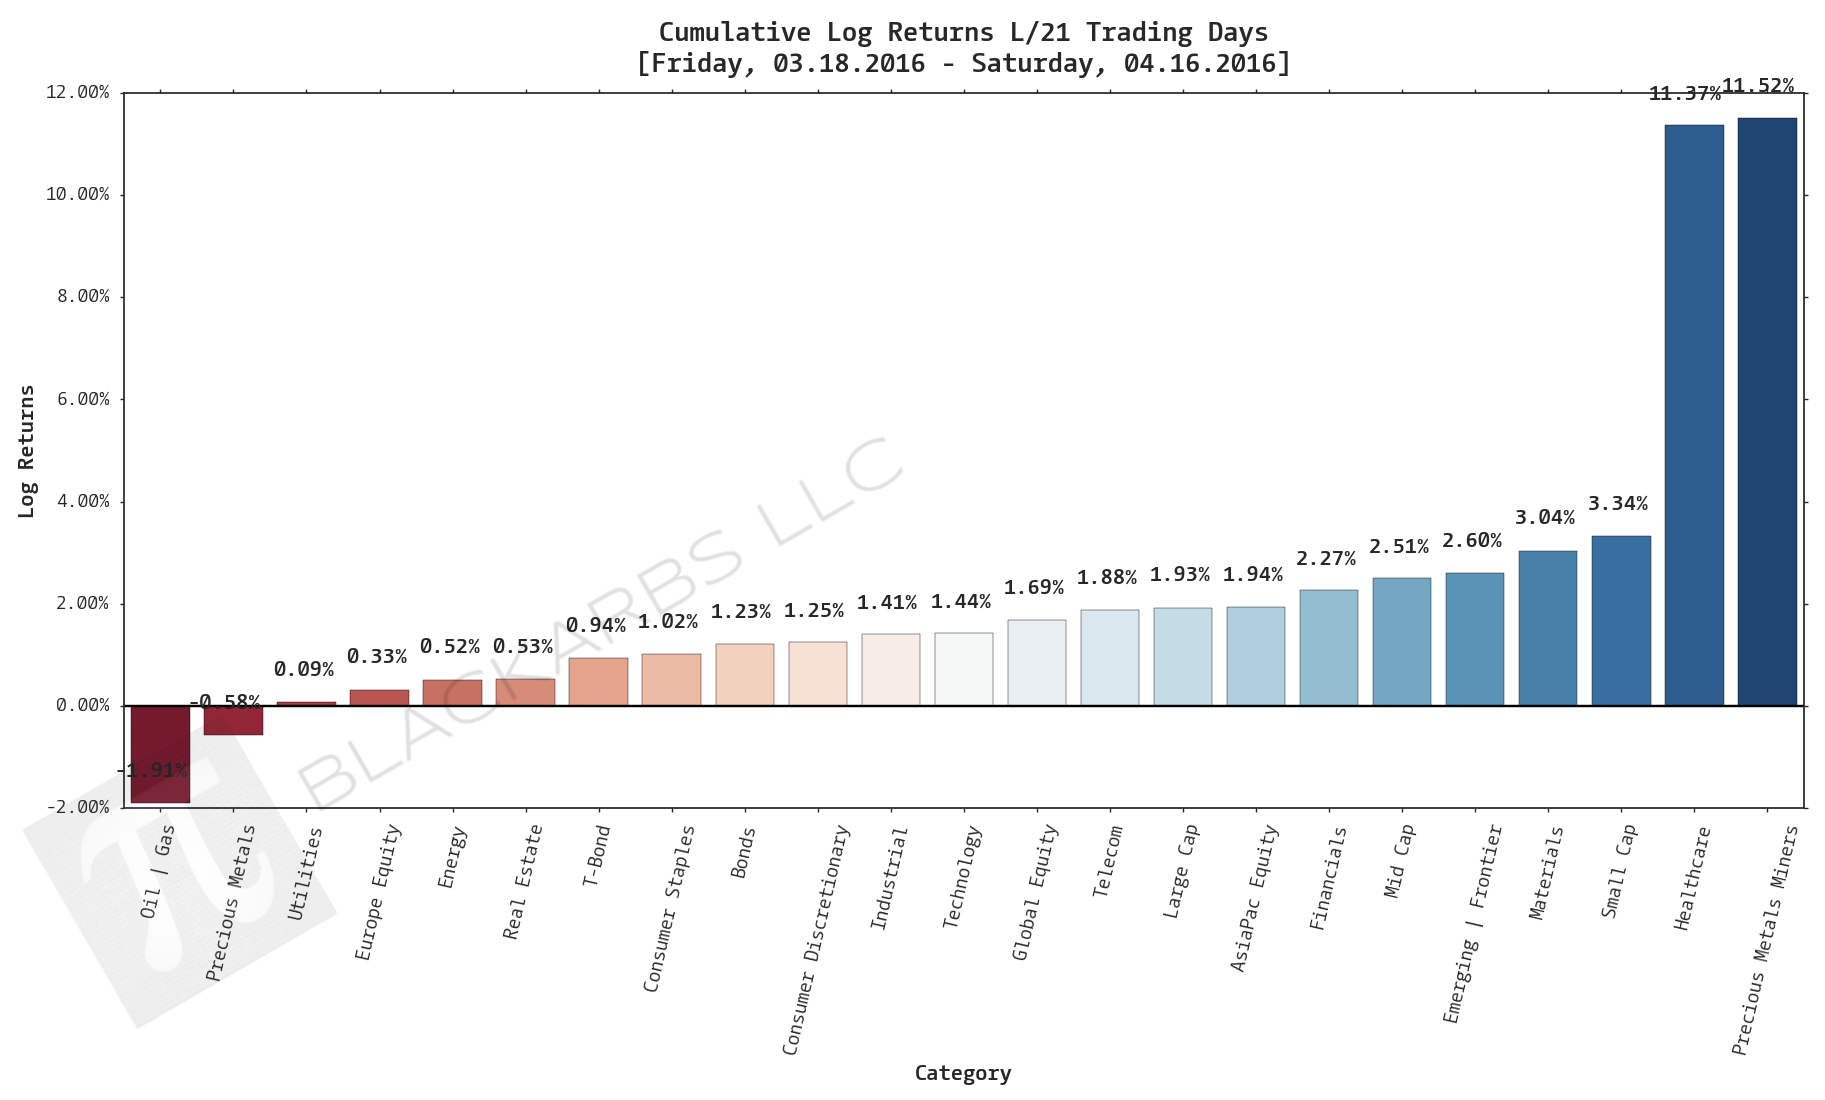
LAST 21 TRADING DAYS


LAST 10 TRADING DAYS


Implied Cost of Capital Estimates:
To learn more about the Implied Cost of Capital see here.
ALL ETF ICC ESTIMATES BY CATEGORY
CATEGORY AVERAGE ICC ESTIMATES
CUMULATIVE RETURN TABLES:
Notable Observations and Trends:
- The Precious Metals Miners composite (PMM) has been a top 3 performer in all timeframes. More research is needed to determine the catalyst if any exists. However the strength of the PMM composite performance indicates there is some long-term conviction behind the buying.
