

COMPOSITE MACRO ETF WEEKLY ANALYTICS (4/30/2016)
/FOR A DEEPER DIVE INTO ETF PERFORMANCE AND RELATIVE VALUE SUBSCRIBE TO THE ETF INTERNAL ANALYTICS PACKAGE HERE
LAYOUT (Organized by Time Period):
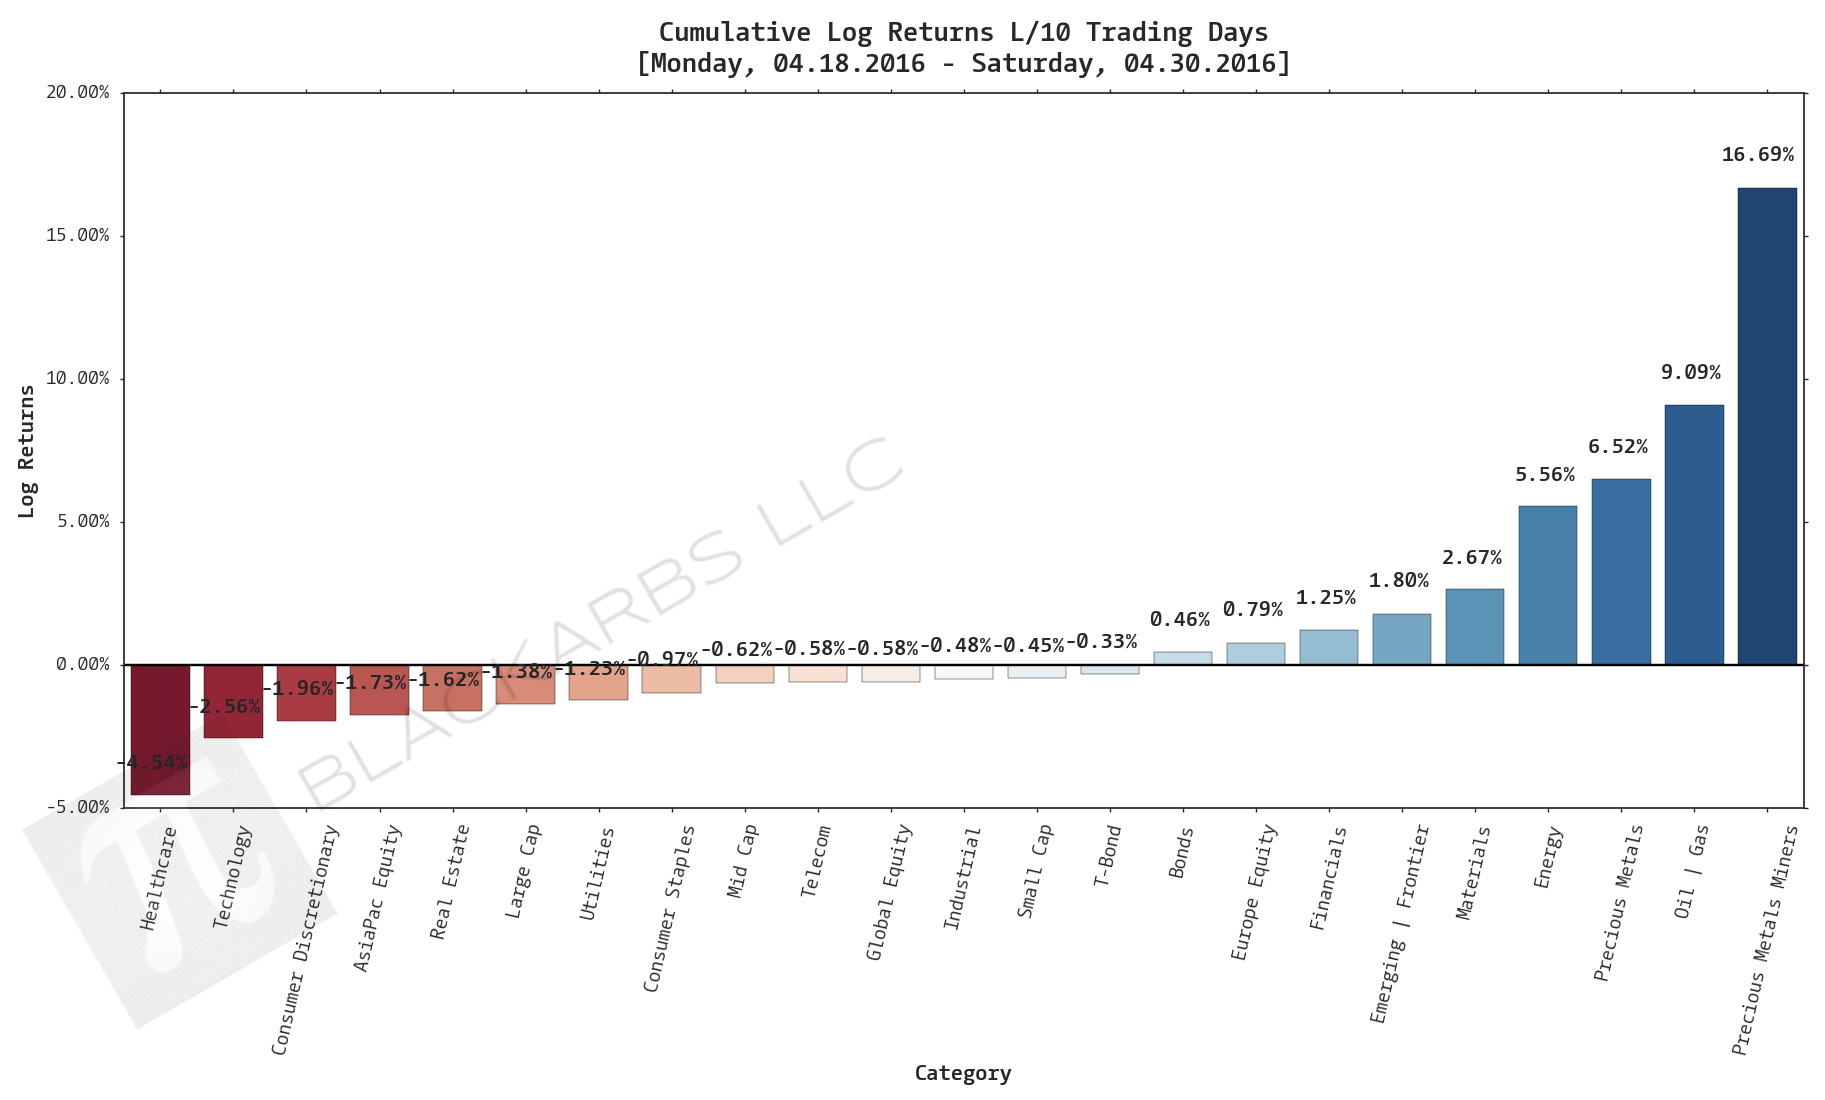
Composite ETF Cumulative Returns Momentum Bar plot
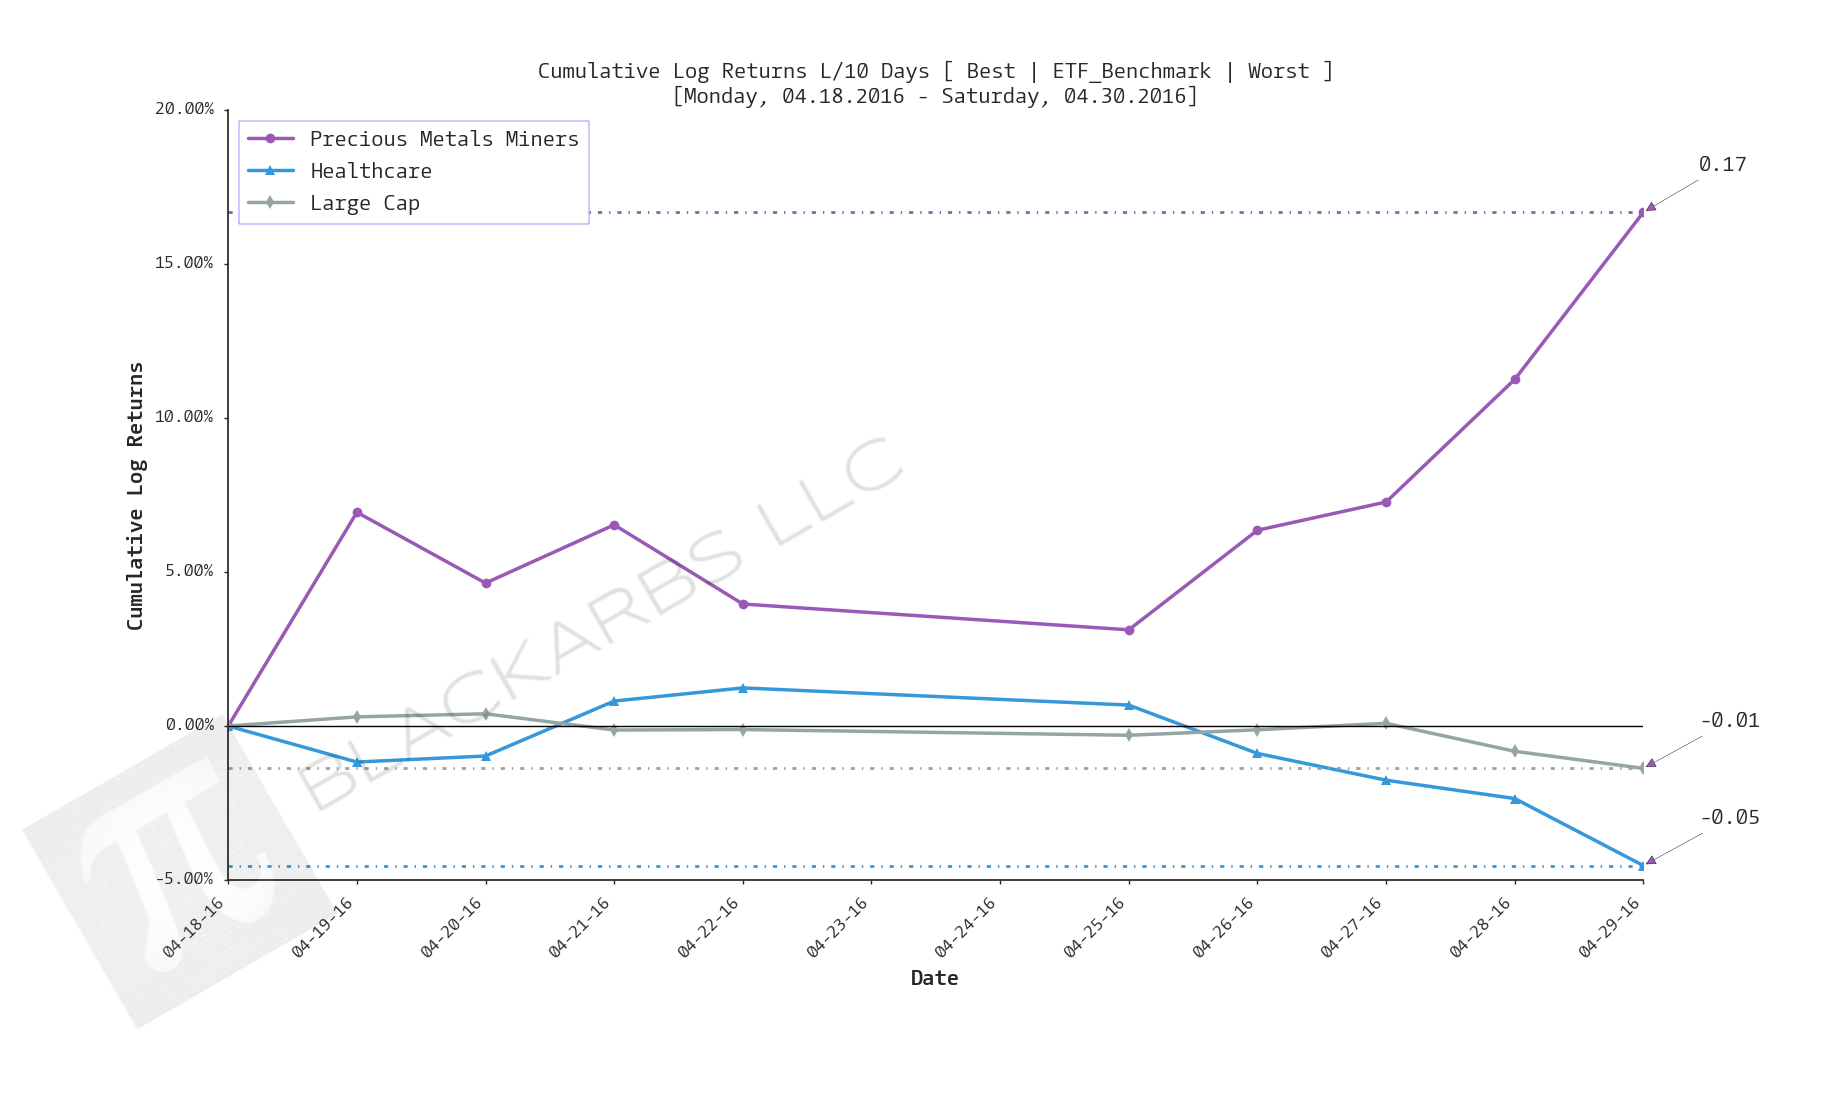
Composite ETF Cumulative Returns Line plot (best vs worst vs benchmark)
Composite ETF Risk-Adjusted Returns Scatter plot (Std vs Mean)
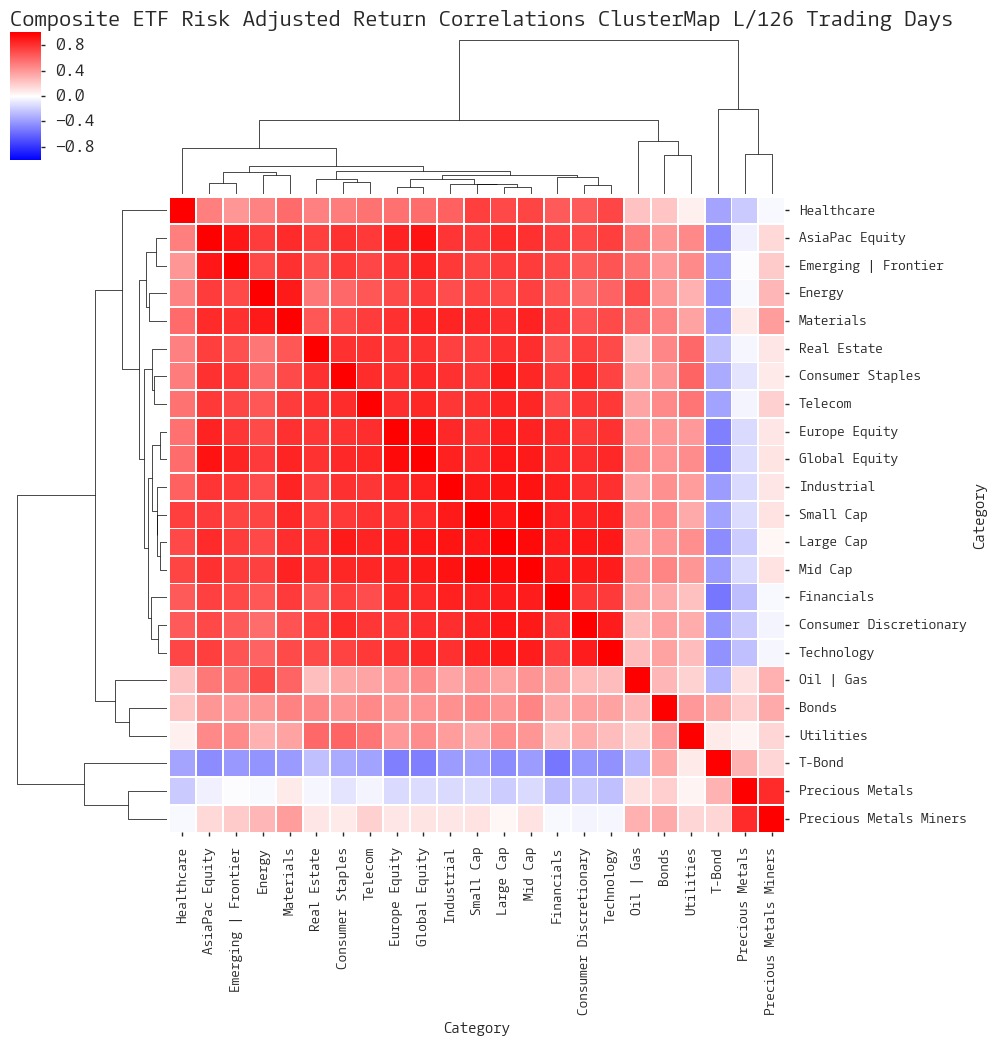
Composite ETF Risk-Adjusted Return Correlations Heatmap (Clusterplot)
Implied Cost of Capital Estimates
Composite ETF Cumulative Return Tables
Notable Trends and Observations
COMPOSITE ETF COMPONENTS:
LAST 252 TRADING DAYS


LAST 126 TRADING DAYS


LAST 63 TRADING DAYS


LAST 21 TRADING DAYS


LAST 10 TRADING DAYS


Implied Cost of Capital Estimates:
To learn more about the Implied Cost of Capital see here.
ALL ETF ICC ESTIMATES BY CATEGORY
CATEGORY AVERAGE ICC ESTIMATES
CUMULATIVE RETURN TABLES:
NOTABLE OBSERVATIONS AND TRENDS:
- The explosive performance of the Precious Metals Miners (PMM) and Precious Metals (PM) composites this year makes me consider that market participants are expecting "unexpected" inflation.
- The "unexpected" inflation theory is supported by the outperformance of the Oil/Gas and Energy composites over the L/63, L/21, and L/10 trading days.
- Composite performance over the L/63 trading days is intriguing. It is the only time frame in which none of the composites had negative performance.
- I still find it somewhat surprising that the Correlation Clustermap (Dendrogram) shows that T-Bonds, PMM, PM are closely correlated with each other offering diversification vs the other composites from the L/126 days onwards.
