

COMPOSITE MACRO ETF WEEKLY ANALYTICS (5/08/2016)
/FOR A DEEPER DIVE INTO ETF PERFORMANCE AND RELATIVE VALUE SUBSCRIBE TO THE ETF INTERNAL ANALYTICS PACKAGE HERE
LAYOUT (Organized by Time Period):
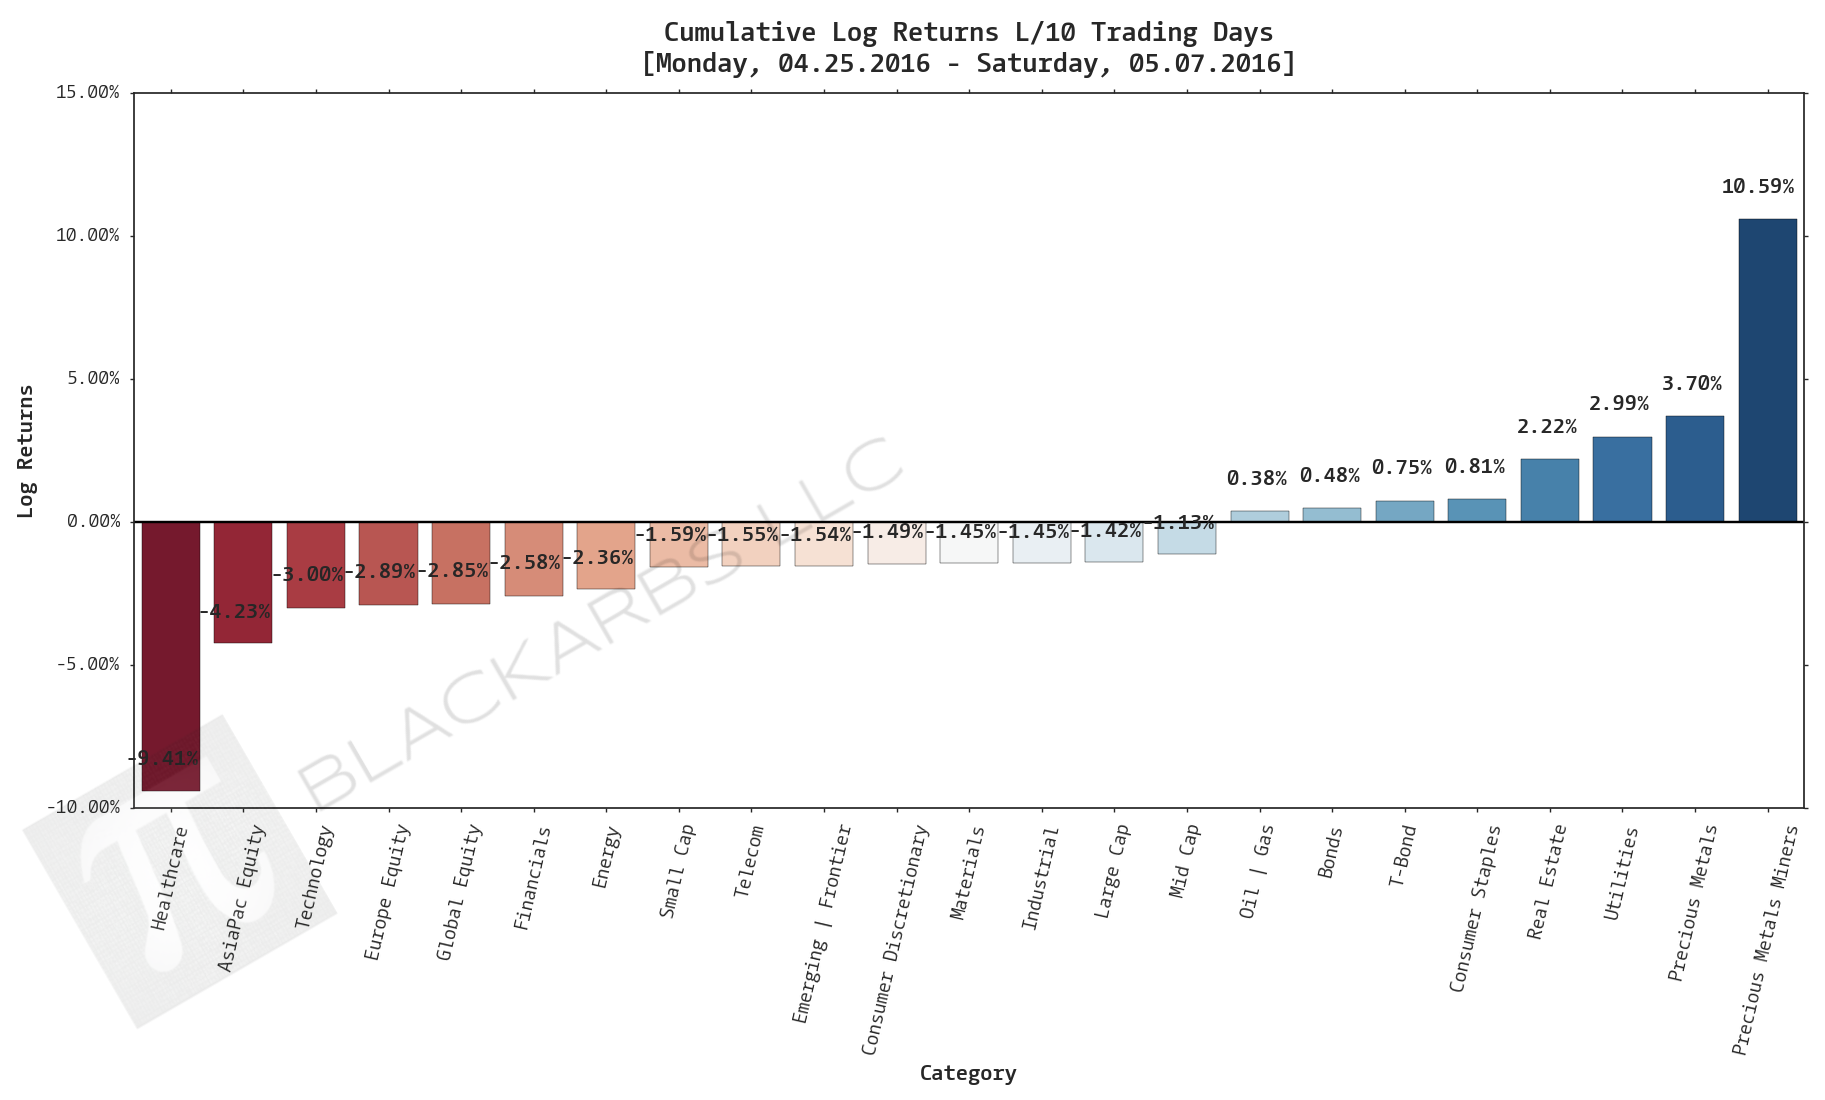
Composite ETF Cumulative Returns Momentum Bar plot
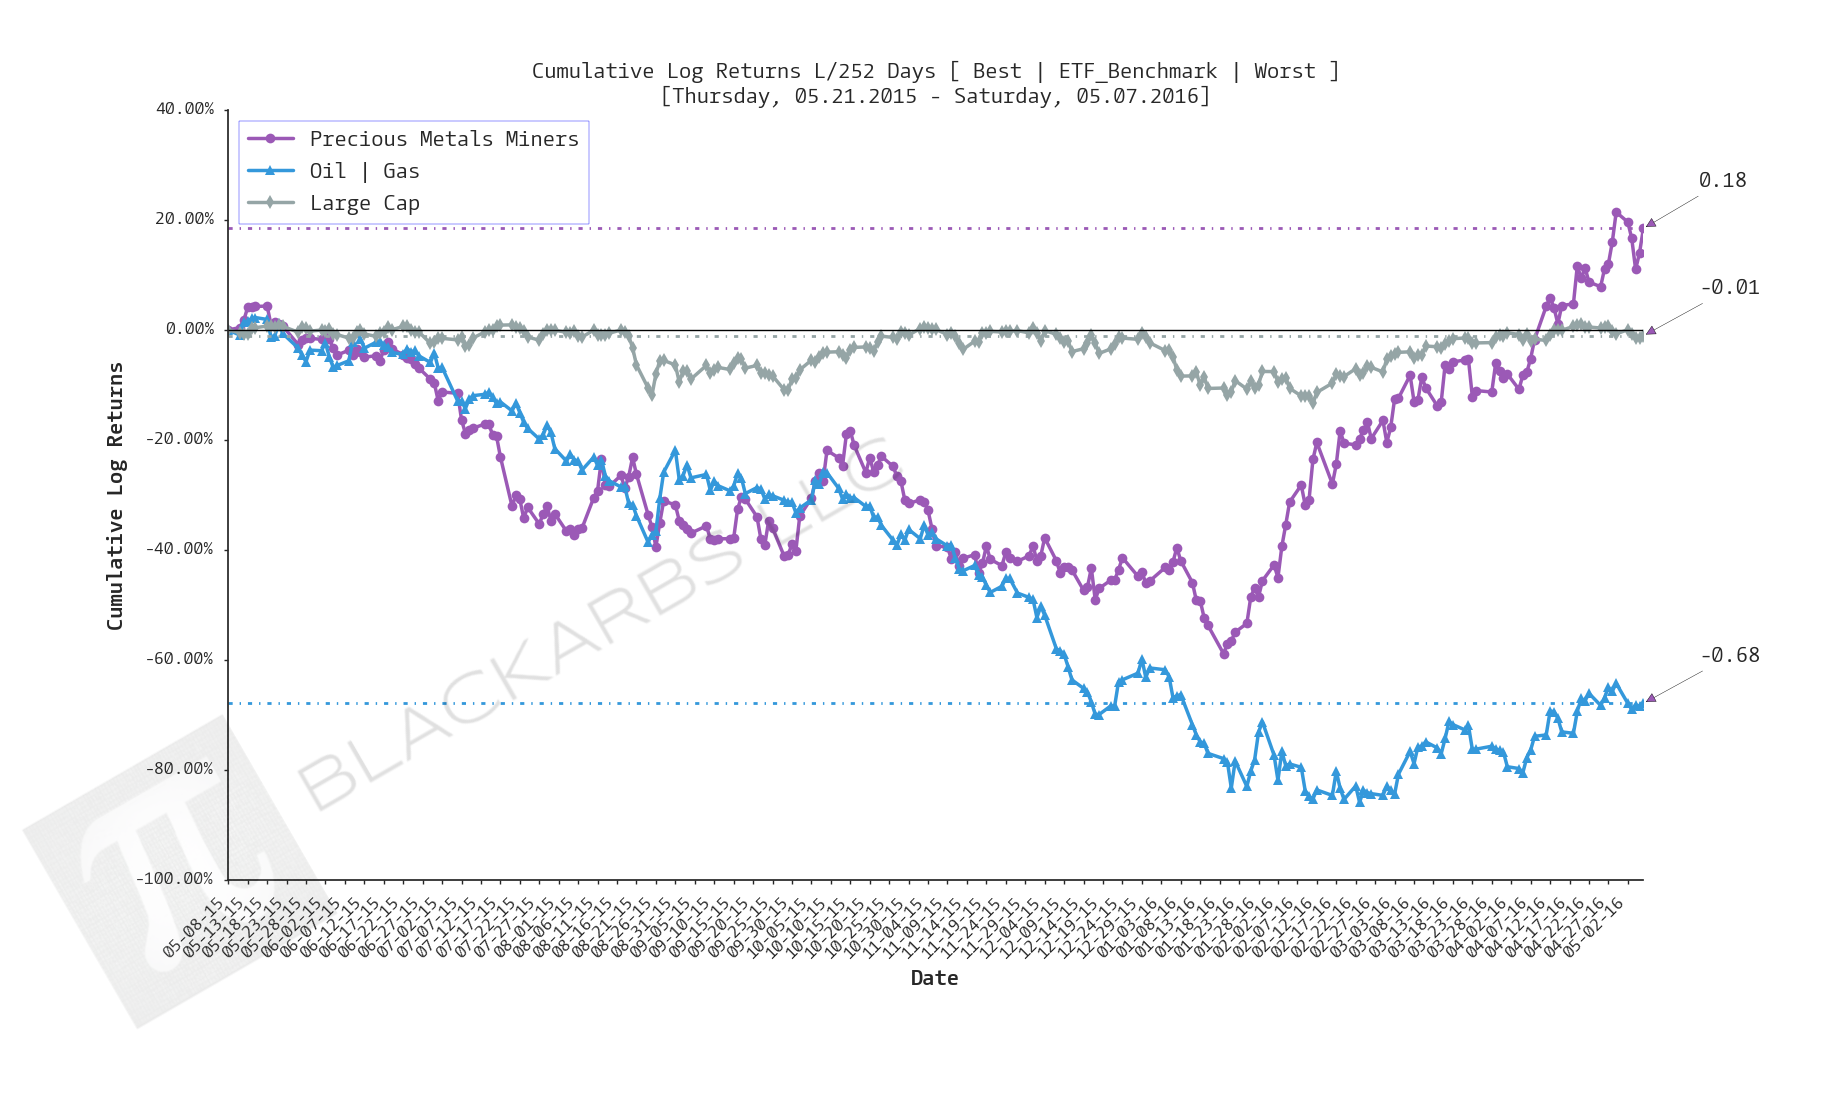
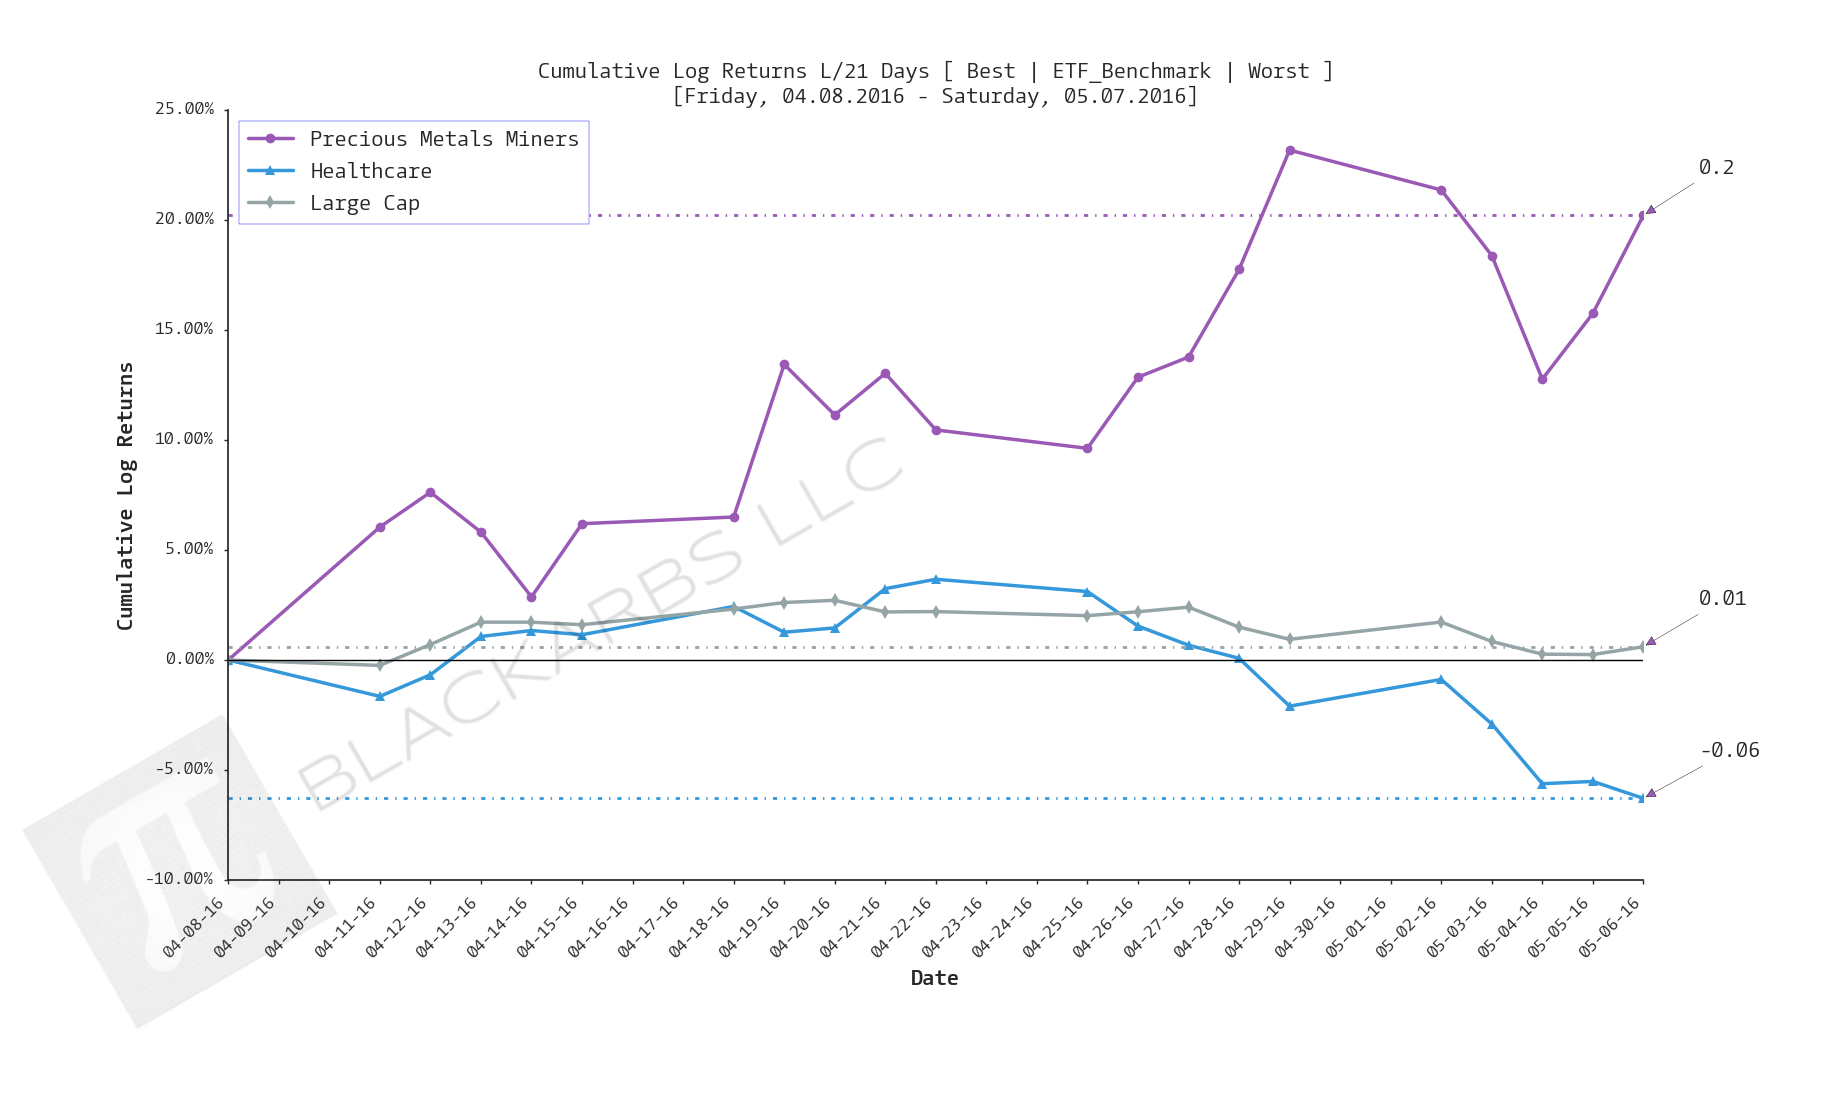
Composite ETF Cumulative Returns Line plot (best vs worst vs benchmark)
Composite ETF Risk-Adjusted Returns Scatter plot (Std vs Mean)
Composite ETF Risk-Adjusted Return Correlations Heatmap (Clusterplot)
Implied Cost of Capital Estimates
Composite ETF Cumulative Return Tables
Notable Trends and Observations
COMPOSITE ETF COMPONENTS:
LAST 252 TRADING DAYS


LAST 126 TRADING DAYS


LAST 63 TRADING DAYS


LAST 21 TRADING DAYS


LAST 10 TRADING DAYS


Implied Cost of Capital Estimates:
To learn more about the Implied Cost of Capital see here.
ALL ETF ICC ESTIMATES BY CATEGORY
CATEGORY AVERAGE ICC ESTIMATES
CUMULATIVE RETURN TABLES:
NOTABLE OBSERVATIONS AND TRENDS:
- None this week.
