Synthetic Data Generation (Part-1) - Block Bootstrapping

Synthetic Data Generation (Part-1) - Block Bootstrapping

Introduction

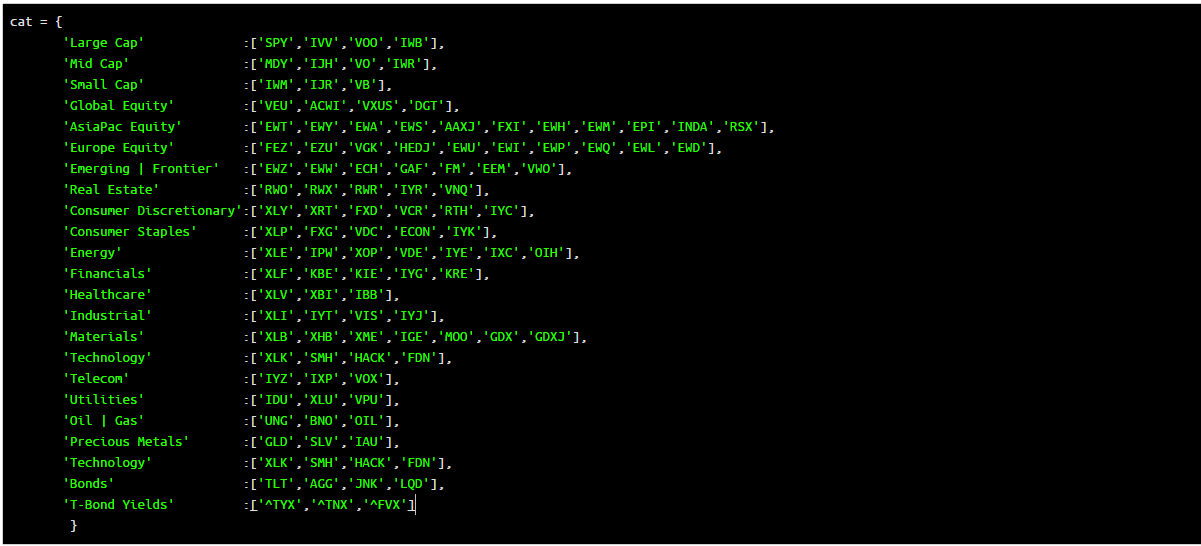
Data is at the core of quantitative research. The problem is history only has one path. Thus we are limited in our studies by the single historical path that a particular asset has taken. In order to gather more data, more asset data is collected and at higher and higher resolutions, however the main problem still exists; one historical path for each asset.

Read More

COMPOSITE MACRO ETF WEEKLY ANALYTICS (2/27/2016)

FOR A DEEPER DIVE INTO ETF PERFORMANCE AND RELATIVE VALUE SUBSCRIBE TO THE ETF INTERNAL ANALYTICS PACKAGE HERE

LAYOUT (Organized by Time Period): 

  1. Notable Trends and Observations

  2. Composite ETF Cumulative Returns Momentum Bar plot

  3. Composite ETF Cumulative Returns Line plot

  4. Composite ETF Risk-Adjusted Returns Scatter plot (Std vs Mean)

  5. Composite ETF Risk-Adjusted Return Correlations Heatmap (Clusterplot)

  6. Implied Cost of Capital Estimates

  7. Composite ETF Cumulative Return Tables

COMPOSITE ETF COMPONENTS:

Notable Observations and Trends:

  • Cumulative returns across a broad spectrum of composites remain weak evidenced by only Utilities and Treasuries showing gains over the last 252 days. 
  • Mid January appears to be a major turning point/trend change for the Precious Metals Miners composite. Looking at the last 126 days Best/Worst plot shows a sharp V bounce which has continued since. 
  • Investors positioning still looks defensive over the longer frames of 252, 126, 63 days as evidenced by the outperformance of the Precious Metals complex, Utilities, and Treasuries. 
  • The market overall still looks binary (risk-on/risk-off) as evidenced by the increase in inverse correlations across timeframes between risk assets (sectors, global, emerging equity) and defensive assets (precious metals, bonds, utilities, telecom) . 

LAST 252 TRADING DAYS

LAST 126 TRADING DAYS

LAST 63 TRADING DAYS

YEAR-TO-DATE LAST 41 TRADING DAYS

LAST 21 TRADING DAYS

LAST 10 TRADING DAYS

Implied Cost of Capital Estimates:

To learn more about the Implied Cost of Capital see here.

CATEGORY AVERAGE ICC ESTIMATES

ALL ETF ICC ESTIMATES BY CATEGORY

Cumulative Return Tables:

COMPOSITE MACRO ETF WEEKLY IMPLIED COST-OF-CAPITAL ESTIMATES VS. CUMULATIVE RETURNS (11/28/15)

WHAT IS THE "IMPLIED COST OF CAPITAL (ICC)" MODEL?

“In accounting and finance the implied cost of equity capital (ICC)—defined as the internal rate of return that equates the current stock price to discounted expected future dividends—is an increasingly popular class of proxies for the expected rate of equity returns. ”

— CHARLES C. Y. WANG; an assistant professor of business administration in the Accounting and Management Unit at Harvard Business School

The basic concept of the ICC model is that it is a forward looking estimate of the implied earnings growth rate of an equity security that is calculated using a combination of book value of equity and earnings forecasts.

To see a more involved explanation of the previous model I used see here.  

In the past I used a Multi-Stage Residual Income Model. However, this time around I've decided to use a simpler Single-Stage Residual Income Model for these estimates. I chose this because I believe the additional complexity is not warranted given my purpose which I will elaborate on further.

The Single-Stage Residual Income Model as defined by the CFA Institute is the following:

source: CFA Institute

'V' is the stock price at time 0, 'B' is the book value of equity at time 0, 'ROE' is return on equity, 'g' is an assumed long term growth rate and 'r' is the cost of equity/capital. The ICC model essentially solves for 'r' given the other inputs. 

WHY USE THE IMPLIED COST OF CAPITAL MODEL?

There is ongoing debate regarding the ICC model's application and accuracy as a proxy for expected returns as quoted by Charles C. Y. Wang. As an investor/trader I'm less interested in the academic debate and more intrigued by the intuition behind the model and its practical application as a relative value tool. 

I use the ICC model as a relative value measure to identify analyst/institutional expectations and sentiment between different market sectors at a point in time. 

For this purpose I believe it provides great insight. 

COMPOSITE ETF COMPONENTS FOR ICC ESTIMATES

Z-SCORE ICC ESTIMATES AND CUMULATIVE RETURNS COMPARISON CHART

The below plot gives visual representation of the ICC estimates. I z-scored both year-to-date cumulative returns and the ICC estimates so we can view them on the same scale. Examining this chart allows investors to quickly determine which market sectors are outperforming (underperforming) their respective Implied Cost of Capital Estimates. 

The extreme cases show where there are disconnects between the analyst community's forward earnings expectations and actual market performance. The plot is sorted left to right by ascending ICC estimates.

YEAR-TO-DATE LAST 237 TRADING DAYS 

Data Sources: YCharts.com, Yahoo Finance

Data Sources: YCharts.com, Yahoo Finance

LAST 126 TRADING DAYS

Data Sources: YCharts.com, Yahoo Finance

Data Sources: YCharts.com, Yahoo Finance

LAST 63 TRADING DAYS

Data Sources: YCharts.com, Yahoo Finance

Data Sources: YCharts.com, Yahoo Finance

LAST 21 TRADING DAYS

Data Sources: YCharts.com, Yahoo Finance

Data Sources: YCharts.com, Yahoo Finance

LAST 10 TRADING DAYS

Data Sources: YCharts.com, Yahoo Finance

Data Sources: YCharts.com, Yahoo Finance

CATEGORY AVERAGE ICC ESTIMATES

Long term growth rate (g) is assumed to be 2.5% reflective of our low growth high debt economic environment. 

ALL ETF ICC ESTIMATES BY CATEGORY

COMPOSITE MACRO ETF WEEKLY ANALYTICS (11/28/2015)

COMPOSITE MACRO ETF WEEKLY IMPLIED COST-OF-CAPITAL ESTIMATES VS. CUMULATIVE RETURNS (11/21/15)

WHAT IS THE "IMPLIED COST OF CAPITAL (ICC)" MODEL?

“In accounting and finance the implied cost of equity capital (ICC)—defined as the internal rate of return that equates the current stock price to discounted expected future dividends—is an increasingly popular class of proxies for the expected rate of equity returns. ”

— CHARLES C. Y. WANG; an assistant professor of business administration in the Accounting and Management Unit at Harvard Business School

The basic concept of the ICC model is that it is a forward looking estimate of the implied earnings growth rate of an equity security that is calculated using a combination of book value of equity and earnings forecasts.

To see a more involved explanation of the previous model I used see here.  

In the past I used a Multi-Stage Residual Income Model. However, this time around I've decided to use a simpler Single-Stage Residual Income Model for these estimates. I chose this because I believe the additional complexity is not warranted given my purpose which I will elaborate on further.

The Single-Stage Residual Income Model as defined by the CFA Institute is the following:

source: CFA Institute

'V' is the stock price at time 0, 'B' is the book value of equity at time 0, 'ROE' is return on equity, 'g' is an assumed long term growth rate and 'r' is the cost of equity/capital. The ICC model essentially solves for 'r' given the other inputs. 

WHY USE THE IMPLIED COST OF CAPITAL MODEL?

There is ongoing debate regarding the ICC model's application and accuracy as a proxy for expected returns as quoted by Charles C. Y. Wang. As an investor/trader I'm less interested in the academic debate and more intrigued by the intuition behind the model and its practical application as a relative value tool. 

I use the ICC model as a relative value measure to identify analyst/institutional expectations and sentiment between different market sectors at a point in time. 

For this purpose I believe it provides great insight. 

COMPOSITE ETF COMPONENTS FOR ICC ESTIMATES

Z-SCORE ICC ESTIMATES AND CUMULATIVE RETURNS COMPARISON CHART

The below plot gives visual representation of the ICC estimates. I z-scored both year-to-date cumulative returns and the ICC estimates so we can view them on the same scale. Examining this chart allows investors to quickly determine which market sectors are outperforming (underperforming) their respective Implied Cost of Capital Estimates. 

The extreme cases show where there are disconnects between the analyst community's forward earnings expectations and actual market performance. The plot is sorted left to right by ascending ICC estimates.

YEAR-TO-DATE LAST 232 TRADING DAYS 

Data Sources: YCharts.com, Yahoo Finance

Data Sources: YCharts.com, Yahoo Finance

LAST 126 TRADING DAYS

Data Sources: YCharts.com, Yahoo Finance

Data Sources: YCharts.com, Yahoo Finance

LAST 63 TRADING DAYS

Data Sources: YCharts.com, Yahoo Finance

Data Sources: YCharts.com, Yahoo Finance

LAST 21 TRADING DAYS

Data Sources: YCharts.com, Yahoo Finance

Data Sources: YCharts.com, Yahoo Finance

LAST 10 TRADING DAYS

Data Sources: YCharts.com, Yahoo Finance

Data Sources: YCharts.com, Yahoo Finance

CATEGORY AVERAGE ICC ESTIMATES

Long term growth rate (g) is assumed to be 2.5% reflective of our low growth high debt economic environment. 

ALL ETF ICC ESTIMATES BY CATEGORY